Introduction
In Indonesia, there are about 102 large and small reservoirs, 80% of which are on Java (Hart et al., 2002). The number of large reservoirs (> 500 ha) is around 15%, and the rest (85%) are small reservoirs. East Java has about 21 reservoirs consisting of two large reservoirs, namely Karangkates and Wonorejo Reservoirs, and 19 small reservoirs, including Widas Reservoir. Widas Reservoir covers an area of 500 ha, is a multipurpose reservoir with the primary role in irrigating rice fields and produces about 650 kW of electric power (Prabowo & Nawiyanto, 2020). Other parts are drinking water sources, tourism, aquaculture, and capture fisheries. This reservoir has the potential to increase fishery production.
The damming of the Widas River, the Berantas Sub-Watershed, and the water source from Mount Wilis arranged the Widas Reservoir. Aside from being subjected to fishing pressure, inland waters are also threatened by local pollution, for instance, microplastic pollution (MP) in the Brantas River (Buwono et al., 2021). However, this issue does not directly damage Widas Reservoir waters, even though the inlet is the Bening River (Bening as transparent), a tributary of the Brantas River. Widas Reservoir provides drinking water (Aida et al., 2018). Another name for Widas Reservoir is Bening Dam, which is 40 km from Madiun City. The average catch is about 283 tons/year, consisting of the following fish species: Cyprinus carpio, Barbonymus gonionotus, Oreochromis niloticus, Pangasianodon hypophthalmus, Notopterus notopterus, Osteochilus vittatus, and Rasbora spp. (Aida et al., 2018).
Fishing activities in Widas Reservoir are very intensive. Several main fishing gears are used daily: cast net, gillnet, pot traps, hook line, scop net, and lift net. Gillnets have recently skyrocketed, mainly operated in reservoir inlets at the beginning of the rainy season to catch spawned fish. The average fish caught in Widas Reservoir yielded from the use of gillnets are approximately 5 kg/day/person, cast net about 3 kg/day/day, pot traps 3 kg/day/person, hook line 2 kg/day/person, and scop net of about 1 kg/day/person. The catch through fishing is insignificant in the Widas Reservoir because of limited fish resources and the increasing number of fishers. Several fish species are rarely found in Widas Reservoir, such as Pangasius, Notopterus, and Clarias (Aida et al., 2018). The main problem is overexploitation, whereby the immature fish, particularly immaturity in the gonad, commence to be caught by locals. For instance, Minnows fish (B. gonionotus), with a size of 16 cm, have been caught intensively, despite the gonad maturity being ready when the size is 28 cm. Therefore, the reproduction cycle is hampered. A similar state is also suffered by Cichlids (O. niloticus) and Barbs fish (O. vittatus) (Aida et al., 2018, 2022a).
Fish stocks in the waters can be lowered if overfishing occurs, decreasing fish populations and even extinction. Fish stock assessment research aims to provide a threshold for optimal utilization of fish resources. Fishing activities should be reasonable, whereby the number of catches should equal the amount of fish recruitment (Sparre & Venema, 1992). Many fishing gear are being operated inland in Indonesian waters, including small and large gears (hook line, cast net, pot traps, barrier trap, filtering device, active seine)—the considerable increase in human population results in the elevated number of local fishers. Therefore, the pressure on the sustainability of fish resources and overexploitation undergoes an upward trend (Utomo & Samuel, 2017).
Widas Reservoir is essential for supporting the fish stock and can contribute to the local community’s economy. Concerning fish sustainability, the number of fish caught in the Widas Reservoir needs to be further controlled. A study of fish stocks is crucial in managing fish resources. Estimating fish stock using hydroacoustic methods has been applied in all aquatic ecosystems (Tsagarakis et al., 2015). Hydroacoustic surveys are increasingly being used to assess the distribution and abundance of freshwater fish. One of the drawbacks of this method is that fish can avoid moving boats, potentially causing bias in the assessment of fish stocks (Wheeland & Rose, 2014). The application of hydroacoustic has grown after being established as a standard method for fish stock assessment (Perivolioti et al., 2020). To date, previous studies in the East Java Reservoir only concern aquatic environmental problems, and a few studies assessed the fish stocks. For instance, Aida & Utomo (2018) examined the carrying capacity for supporting floating net cages in Pondok Reservoir, East Java. On the other hand, the arrangement of sluice gates in reservoirs for rice fields has been studied by Susilo (2019). Viani & Retnaningdyah (2018) surveyed the variability of water quality in East Java’s Lahor Reservoir. Relating to the fish stock, Widas Reservoir is stocked annually (Utomo et al., 2019). However, no further assessments based on the stocked fish data have been analyzed, particularly the sustainability assessment and the overexploitation status. Thus, these aspects should be investigated to provide the recent status and input for the sustainable management of fish resources. This study aims to unravel the standing stock, growth parameters, mortality, and exploitation rates of several dominant fish in Widas Reservoir.
Materials and Methods
The research was carried out at the Widas Reservoir in East Java, Indonesia, from February to November 2019. The research consisted of a field survey, stock estimation experiments based on acoustic data, and collecting fish catch and size data from enumerators. The fish catch data was collected every day, while the measurement of fish size was conducted every two weeks. The survey was conducted thrice in March, June, and September 2019 to collect data from enumerators and fish sampling. Meanwhile, a survey of fish stock assessment using acoustic instruments was conducted in June 2019. Based on preliminary information about fishing activities, it is suspected that the status of fish stocks in the Widas Reservoir has been overfishing.
It is necessary to input data on fish length frequency in a time series to estimate growth and mortality parameters. The length frequency distribution was carried out on several dominant fish species in the Widas Reservoir, such as O. niloticus, B. gonionotus, and O. vittatus. Fish samples were obtained from various fishing gears, with the help of local fishers as enumerators. The fish caught were taken randomly with a scoop net, then the total length of the fish was measured (cm). The recording of fish catch data was performed every day, while the measurement of fish length was carried out every two weeks.
Growth parameters were estimated using the Von Bertalanffy growth equation as follows:
where:
Lt = the length at age
L∞ = the asymptotic length
K = the growth factors
t0 = the theoretical age when the size of fish is zero.
Data analysis used the Electric Length Frequency Analysis (ELEFAN) program (FAO, Rome, Italy) in the Fish Sock Analysis Tool, II (FISAT II) program package (FAO, Rome, Italy; Gayanilo et al., 1995). The total mortality parameter (Z) was analyzed using the Jones and Van Zalinge method (Sparre & Venema, 1992), which was based on group length and growth parameters obtained as follows:
where:
C(L,L∞) = Cumulative catch at length L (cm)
L∞ = Infinity length
K = Growth constant
Z = Total mortality
On the other hand, natural mortality parameters (M) based on Pauly’s empirical equation was also calculated (Pauly, 1984):
Fishing mortality parameters (F) = Z − M, and fishing rate E = F / Z, (E > 0.5 indicates overfishing) (Pauly, 1984).
Bathymetry and fish stock surveys were conducted in June 2019 using an acoustic device SIMRAD EY-60 (SIMRAD, Notteroy, Norway; portable echosounder) with a 120 kHz transducer and a global positioning system (GPS) tool. The transducer was installed and mounted on the right side of the boat with a 3 gross tone (GT) engine. The position of the transducer was vertical, pointing down so that the vertical beams could provide a representative approximation for the water column. The echosounder was connected to a portable computer, which offers real-time viewing and data storage on the hard disk.
Scientific echosounders can estimate the intensity of the echo/reflection of sound from the fish’s body to the echosounder (target strength, TS). Several models describing the relationship between fish size and TS should be used to detect fish using Single Echo Detection (SED) as a source of average target power (TS) to evaluate fish density (Lian et al., 2017). The second step is converting fish size into biomass (weight) by applying the length-weight relationship. The echo data was processed with Sonar 5-Pro and analyzed using Microsoft Excel 2019.
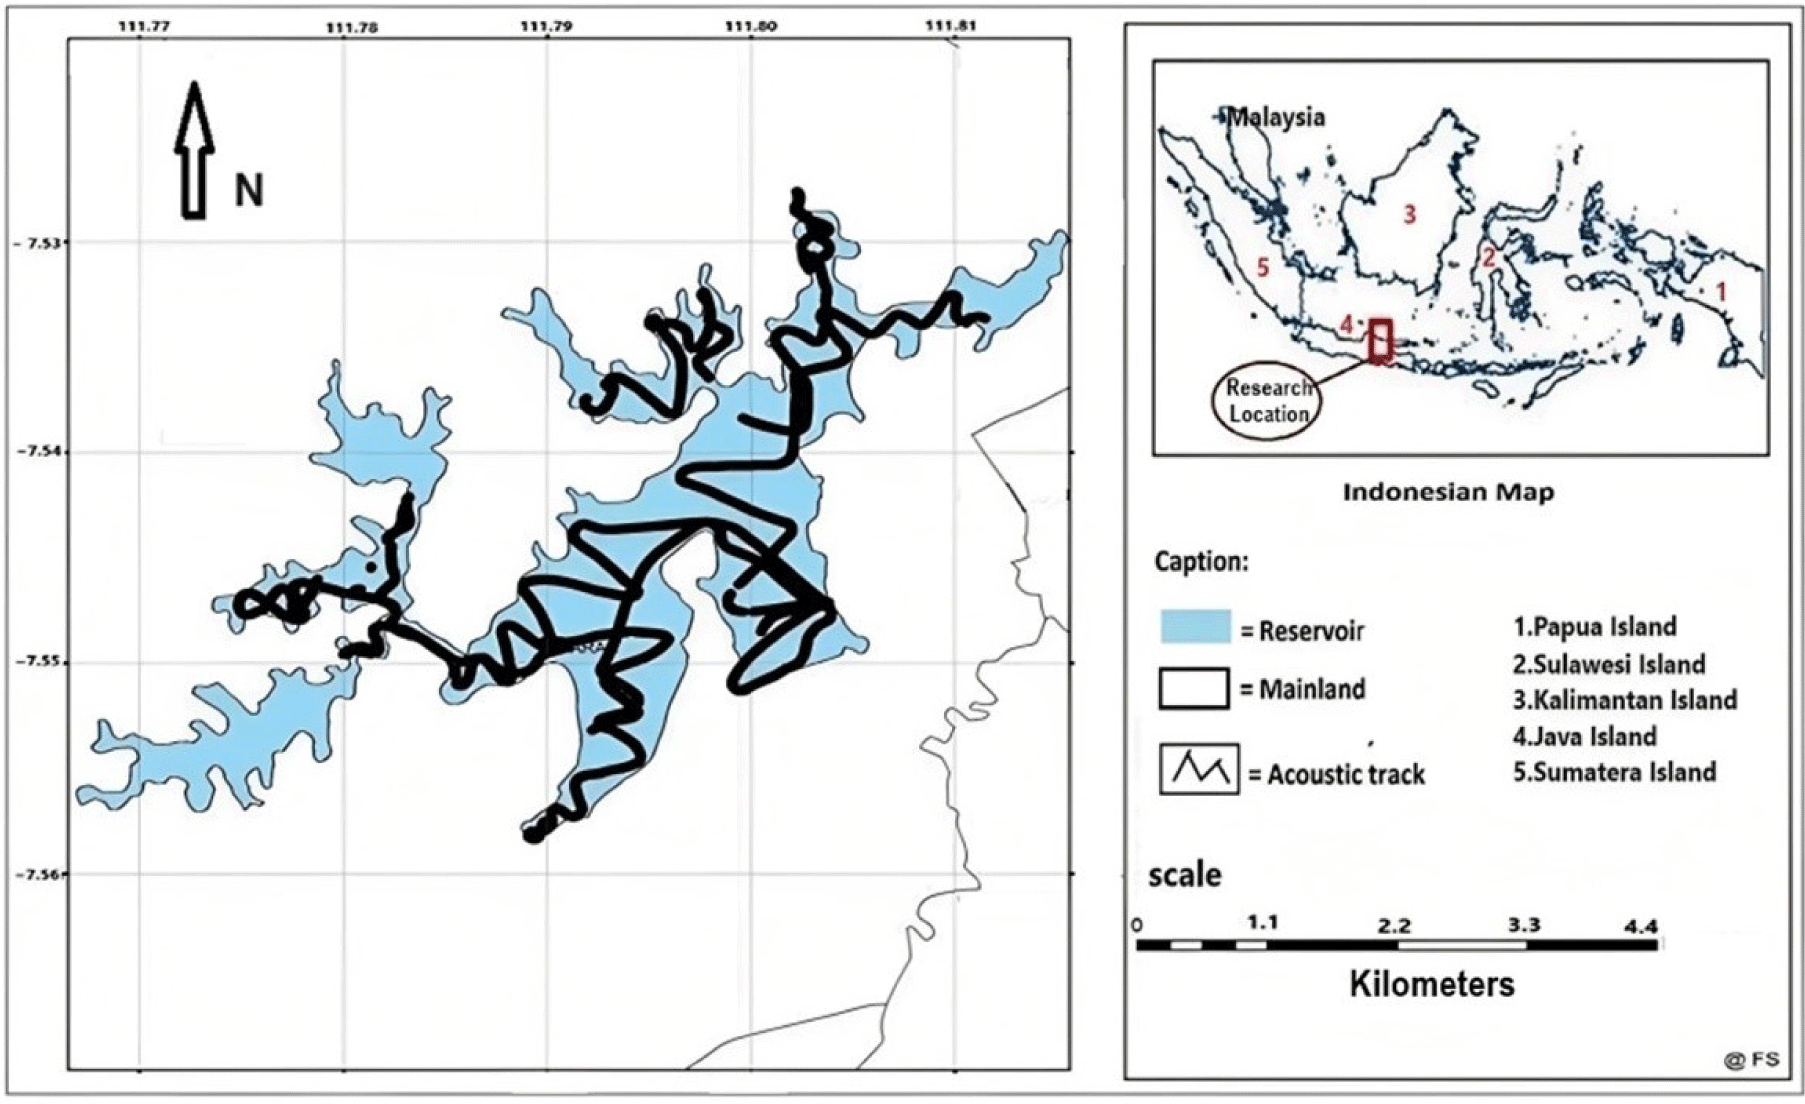
Real-time data acquisition was performed using the ER60 software. Further acoustic data processing was conducted using SONAR-4 software (Cakewalk, Boston, MA, USA; Table 1). The survey pattern followed zigzag transects in the reservoir waters representing the types of reservoir water bodies such as bays, middle of reservoirs, and reservoir edges (Fig. 1). We also sampled fish composition from multi-fishing gear, including gillnets from various mesh sizes, cast nets, and lift nets.
Estimating fish species composition was performed by recording fish catches by several fishers as enumerators. The fishing gear used is nonselective fishing gear that can catch fish of various species and sizes. The length frequency data of fish was approached by measuring the total length of fish every two weeks, whereas the fish catch data were recorded daily by the enumerator using a specific form. The catch data recorded includes the type of fishing gear used, the time of catching, the amount of catch (kg), and the composition of fish species (%).
All data retrieved from the echo sounder should be stored on the computer’s hard disk for further processing using Simrad ER60 software (Renfree & Demer, 2016). The acoustic data were processed using ECHOVIEW version 5, yielding a backscattering coefficient (coefficient of fish cross-section) and distribution of single fish TS values in decibels (dB) as a reflection index of fish size (Mello & Rose, 2009). TS is the strength of a target (fish) to reflect acoustic sounds and has a close relationship with the size of the fish. The larger the size of the fish, the greater the TS value. After gaining the values and characteristics of the fish’s TS, fish stocks and abundant resources can be estimated. According to Hannachi et al. (2004), the relationship between TS and óbs (backscattering cross-section, mm2) can be calculated by converting the TS value to length (L) for fish using the following equation:
For converting fish size into fish weight using the equation as follows:
where:
L = Total length (cm)
W = Total weight (g)
Then all existing individual fish sizes can be changed into fish biomass.
Results
An assessment of the population dynamics of the dominant fish often caught has been performed to determine the status of fish stocks in the Widas Reservoir. The dominant fish are B. gonionotus, O. niloticus and O. vittatus. Based on the length frequency data analysis of the dominant species, the maximum length (L∞), growth (K), natural mortality (M), total mortality (Z), fishing mortality (F), and exploitation rate (E) has been calculated as presented in Table 2.
| Fish species | L ∞ (cm) | K = (year−1) | M = (year−1) | Z = (year−1) | F = (year−1) | E |
|---|---|---|---|---|---|---|
| B. gonionotus | 45 | 0.63 | 1.24 | 4.78 | 3.54 | 0.74 |
| O. niloticus | 44.4 | 0.7 | 1.30 | 7.55 | 6.25 | 0.83 |
| O. vittatus | 29 | 0.55 | 1.25 | 3.70 | 2.45 | 0.66 |
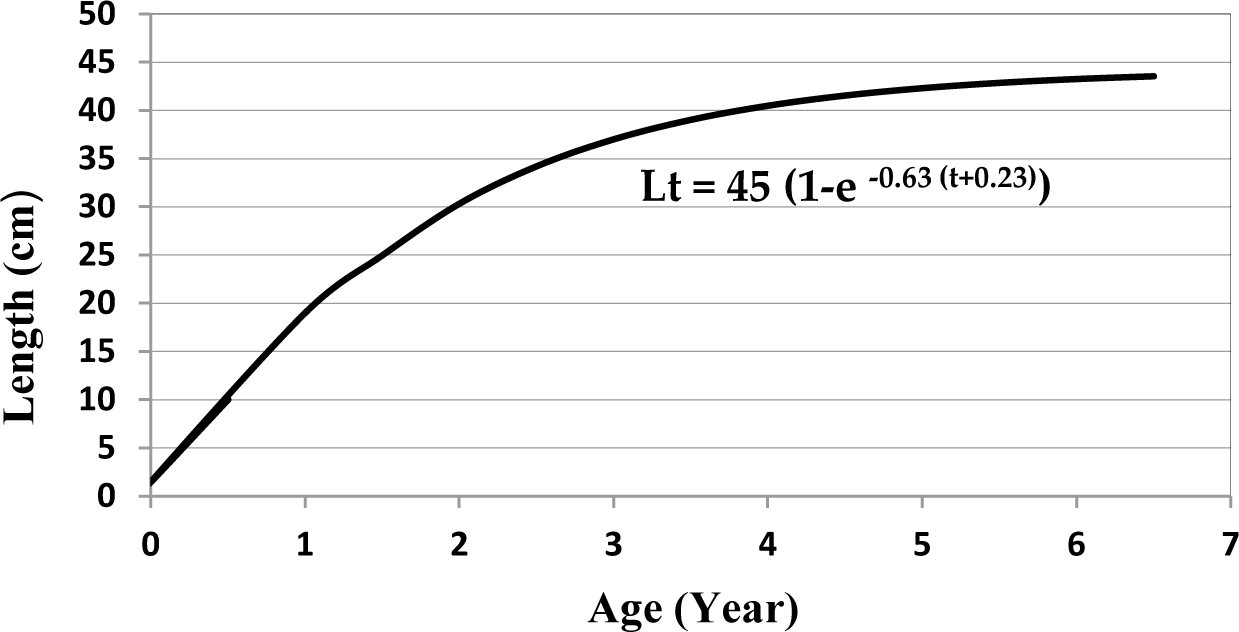
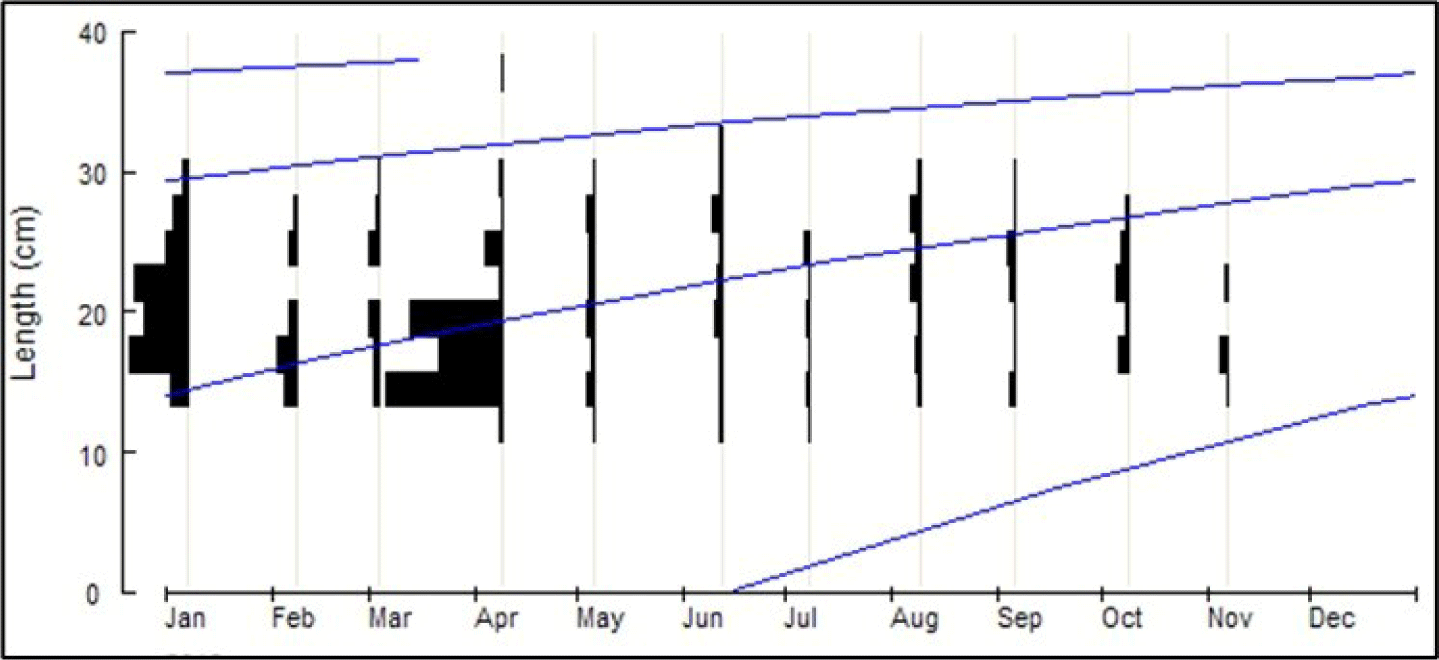
The length distribution (cm) of Tawes/Minnows fish was between 8.0–36 cm, and the number of samples (n) taken for the analysis was 860 fish (Fig. 2). Based on the analysis of fish size, the infinitive length (L∞) = 45 cm, K = 0.63 year−1 and t0= −0.23 year, the equation for the growth of Vont Bertalanffy: Lt = 45(1 − e−0.63(t+0.23)) (Fig. 3). Assuming the average water temperature is 29.5°C, based on an empirical equation, natural mortality (M) = 1.24 year−1. Based on Jones and Van Zalinge Plot analysis on the size composition of Tawes/Minnows, the results obtained were total mortality (Z) = 4.78 year−1, the fishing mortality parameter was (F) = 3.57 year−1 and the exploitation rate (E) = 0.74. The fishing mortality (F) is greater than the natural mortality (M), and the exploitation rate E > 0.5 is an indicator of overfishing.
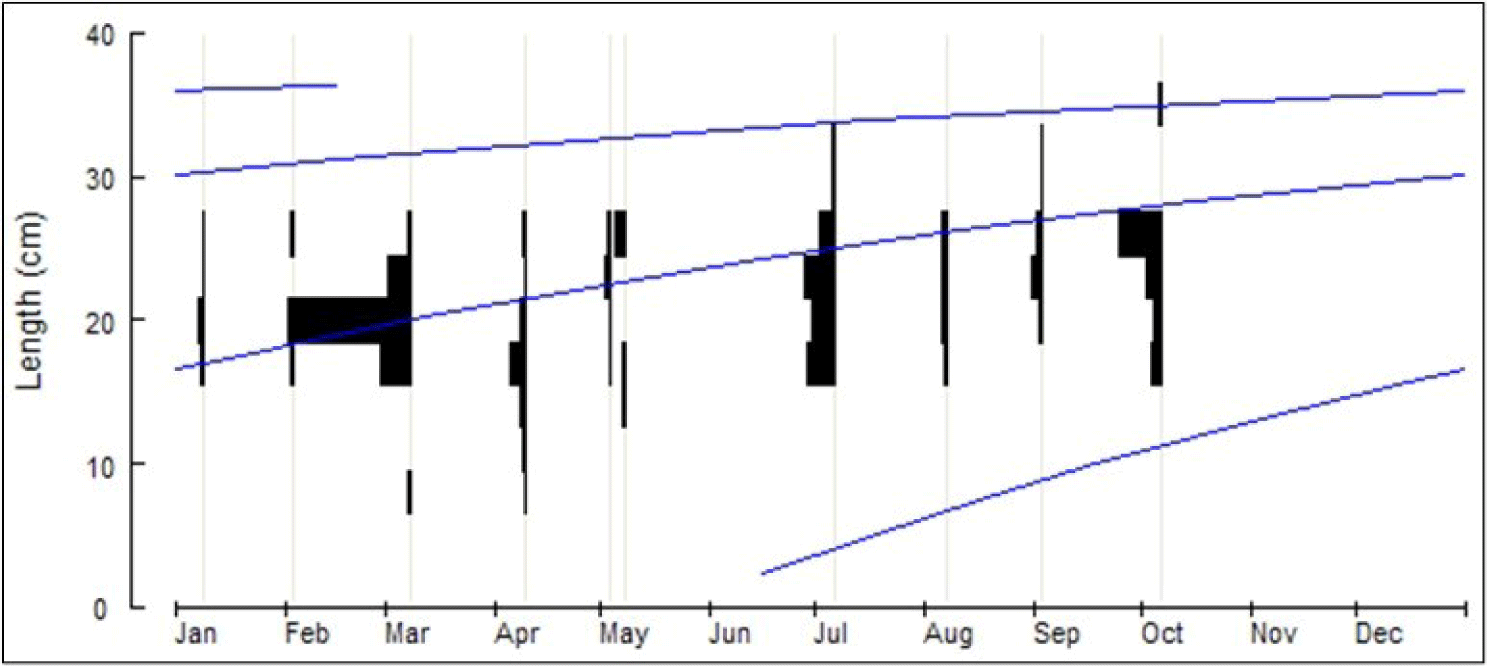
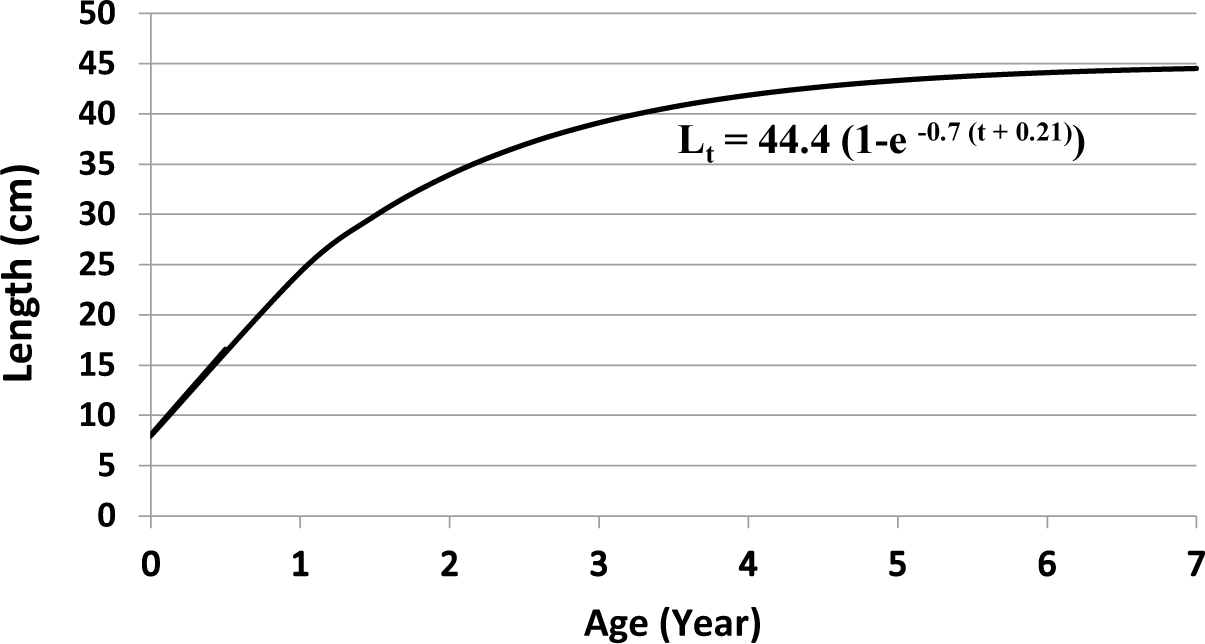
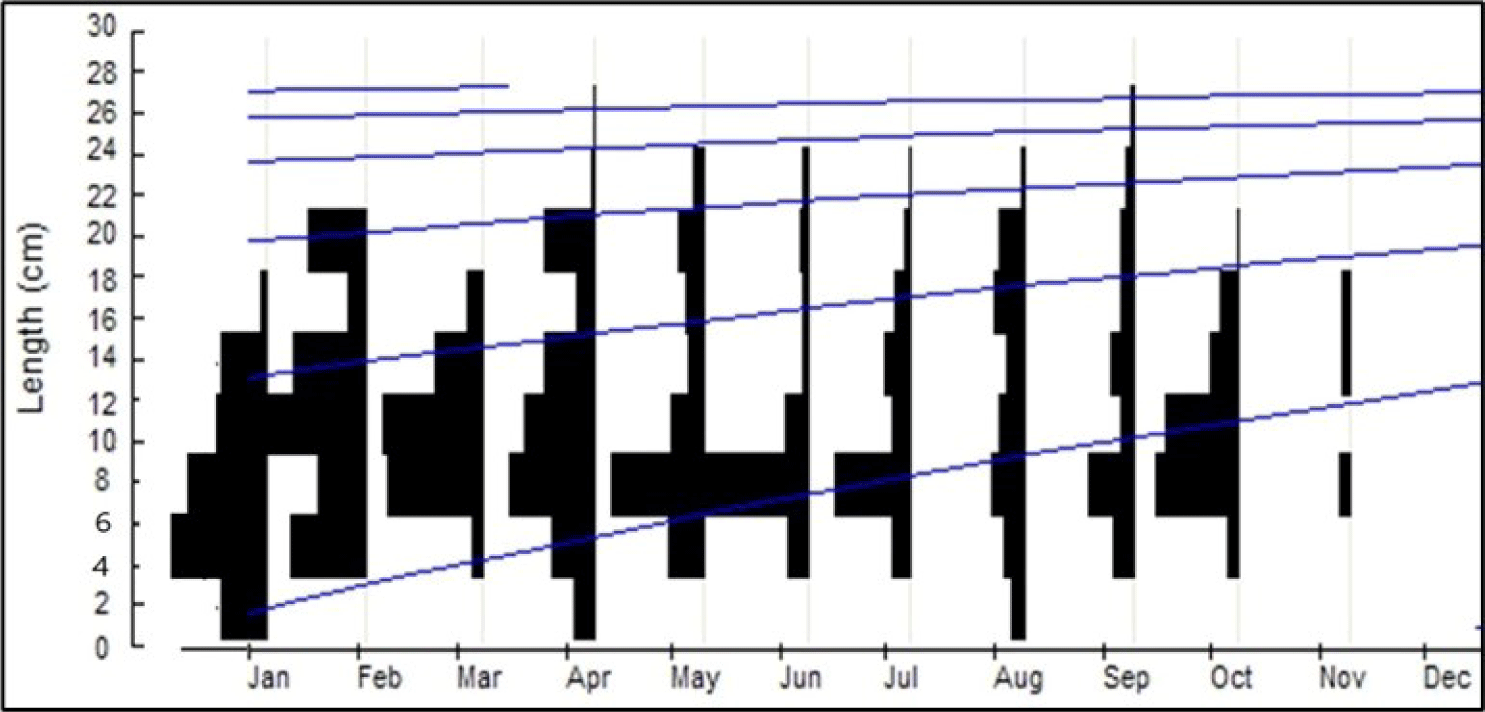
The size of the Nila/Cichlid sample ranged from 11.1 to 35 cm. The number of samples (n) was 4,452 fish (Fig. 4). Based on the analysis of the length-frequency data, the infinitive length was (L∞) = 44.4 cm, K = 0.7 year−1 and t0= −0.21 year and the growth equation Lt=44.4 (1 − e−0.7(t+0.21)) (Fig. 5). Assuming an average temperature of 29.5 ± 5°C, based on the empirical equation, the natural mortality parameter value was (M) = 1.30 year−1. Based on the Jones and Van Zalinge plot analysis on the size composition of Nila/Cichlid fish during the study, the results obtained were total mortality (Z) = 7.55 year−1, fishing mortality (F) = 6.25 year−1, and the exploitation rate (E) = 0.83. The fishing mortality (F) is greater than the natural mortality (M), and the exploitation rate E > 0.5 is an indicator of overfishing.
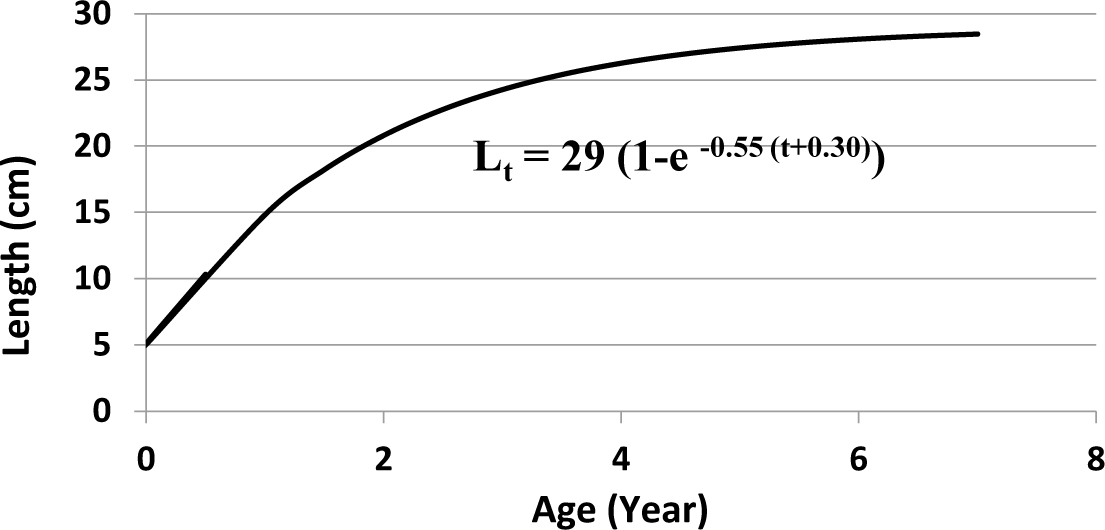
Based on length frequency data analysis of Karper/Barbs fish, the infinitive length L∞ = 29 cm, K = 0.55 year−1, t0 = −0.30, and the growth equation is Lt= 29 (1 − e−0.55(t + 0.30)). The number of samples (n) taken for analysis was 2,593 fish (Figs. 6 and 7). Assuming an average temperature of 29.5°C, based on Pauly’s empirical equation, the natural mortality parameter value (M) = 1.25 year−1. Based on the Jones and Van Zalinge plot analysis on the size composition of Karper/Barbs fish during the study, the results obtained were total mortality (Z) = 3.7 year−1, fishing mortality (F) = 2.45 year−1 exploitation rate (E) = 0.66. The fishing mortality (F) is greater than the natural mortality (M), and the exploitation rate E > 0.5.
The average density based on the depth stratification is 1–5, 6–10, 11–15, and > 15 m (Table 3). The average value of fish density tended to be higher in the surface layer. The highest average density between 1–5 m beneath the surface was 20.7 Ind/m3. In comparison, the lower fish density was identified in the deeper layer (> 15 m), reaching 0.2 Ind/m3, with an average of 5.4 Ind/m3. Based on the acoustic survey results, small fish with a TS less than −47 dB were mainly detected in the surface layer, with a depth between 1–5 m. This value gradually declined in the deeper layer. Meanwhile, fish with a higher TS value (TS > −47 dB) tended to increase gradually according to depth and then decreased at a depth of more than 15 m (Table 4).
| Depth | Ind (m3) |
|---|---|
| 1–5 m | 20.7 |
| 6–10 m | 3.0 |
| 11–15 m | 0.6 |
| > 15 m | 0.2 |
| Average | 5.4 |
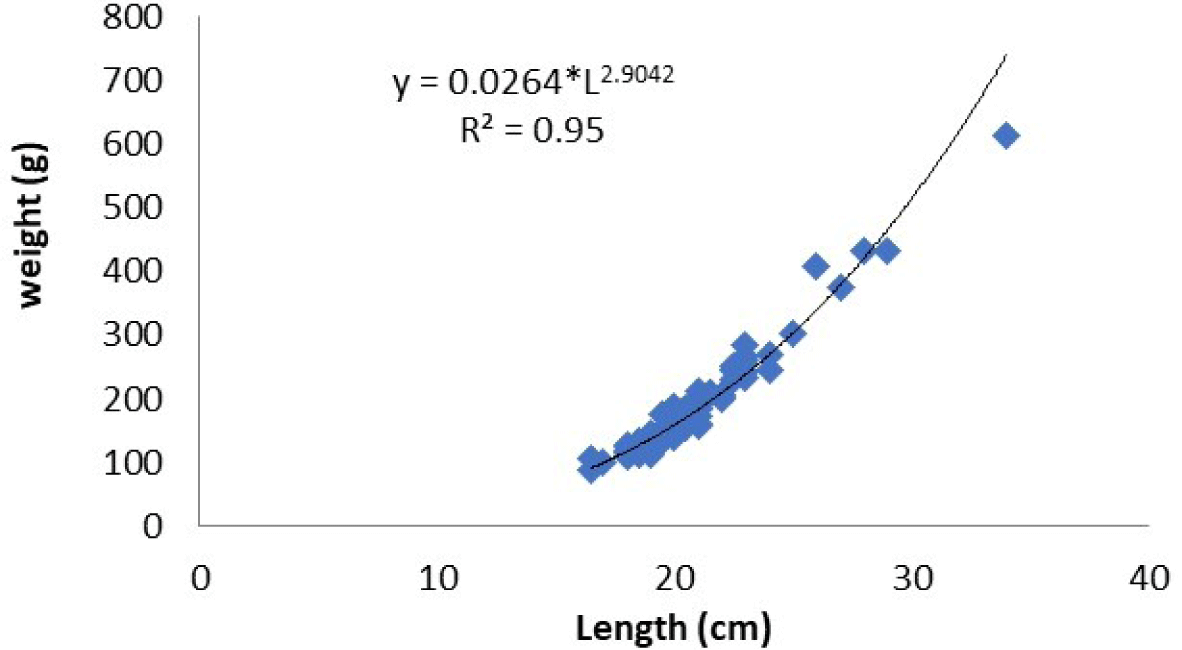
The value of fish size (cm) should be converted to weight (g) by analyzing the relationship between length and weight of fish to determine the fish biomass. The fish selected for analysis of the relationship between length and weight was Nila/Cichlid (O. niloticus) because it is very dominant in Widas Reservoir and easy to catch from various sizes. Based on data analysis of length (cm) and weight (g), the relationship between length and weight can be explained by W = 0.026 L2.904 (Fig. 8). After converting the fish size into weight, it can estimate fish biomass in the reservoir. Closer to the bottom of the reservoir, the channel becomes narrower. The surface area of the reservoir to a depth of 5 m was approximately 2.2 mile2, 6–10 m was 1.2 mile2, 11–15 m was about 0.4 mile2, and the area of reservoir to the depth of > 15 m was 0.2 mile2.
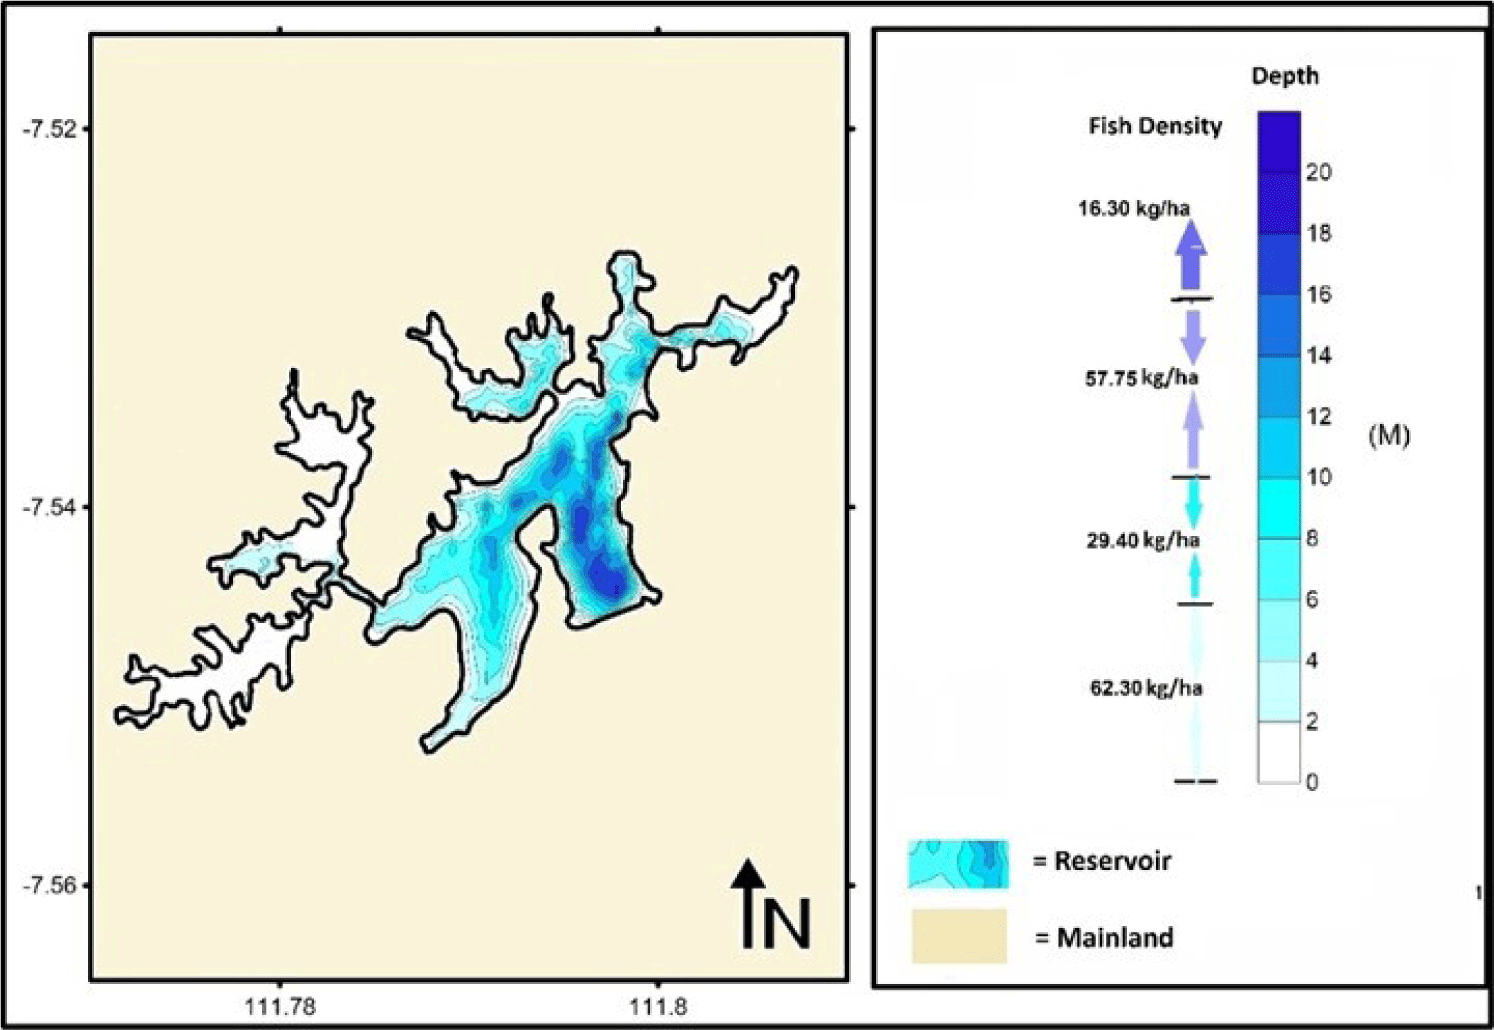
The estimated biomass was 58,813 kg for the depth of 1–5 m, 11,998 kg for the depth of 6–10 m, 7,828 kg for the depth of 11–15 m, and 1,219 kg for the depth of 15–20 m, respectively. Therefore, the total biomass for the Widas Reservoir was approximately 79,848 kg or 165.67 kg/ha (Table 5 and Fig. 9).
| Depth | Biomass (kg) | Biomass (kg/km2) | Biomass (kg/ha) |
|---|---|---|---|
| 1–5 m | 58,813 | 6,235.32 | 62.35 |
| 6–10 m | 11,988 | 2,946.47 | 29.46 |
| 11–15 m | 7,828 | 5,750.87 | 57.51 |
| > 15 m | 1,219 | 1,634.46 | 16.34 |
| Total | 79,848 | 16,567.11 | 165.67 |
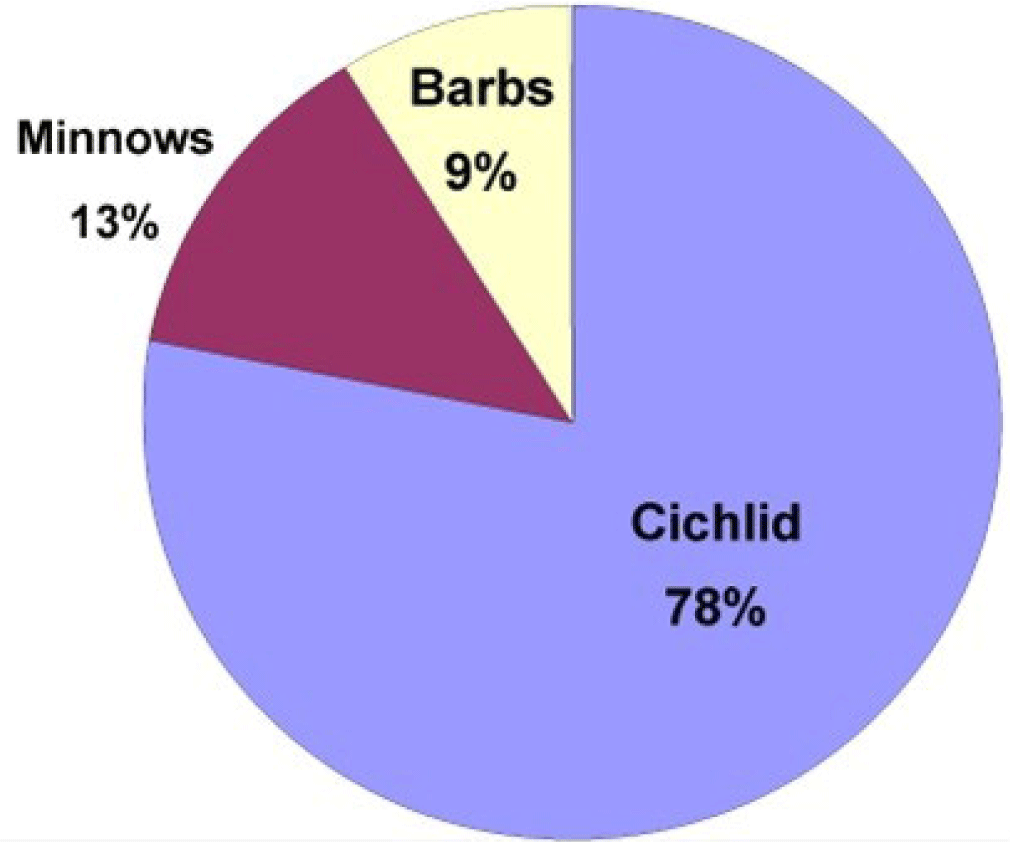
The catch of fish in Widas Reservoir using gillnet (mesh size = 2–3 inch) was 5–8 kg/day/person, consisting of 78% Cichlid (Oreochromis), 13% Minnows (Barbonymus), and 9% Barbs (Osteochilus) (Fig. 10). The fish stock in the Widas Reservoir was about 79,848 kg. If the composition of fish species in the stock follows the composition of the catch. Thus, the fish stock in the Widas Reservoir consists of Cichlid 62,281 kg, Minnows 10,332 kg, and Barbs 7,235 kg.
The maximum sustainable yield (MSY) for the Cichlid was about 233,553 kg, the Minnows group 24,280 kg, and the Barbs 13,384 kg, respectively. The total allowable catch (TAC) for the Cichlid was approximately 186,842 kg, Minnows 19,424 kg, and Barbs 10,707 kg. The exploitation rate (E) for the Cichlid fish group was 0.83, Minnows 0.74, and Barbs 0.66, respectively (Table 6).
Discussion
Research on the study of fish stocks in inland waters, especially in East Java, still needs to be completed, making it difficult to document the potential of inland fisheries resources for their management. Information on growth, mortality, and exploitation rate parameters is needed for managing fish resources (Raghavan et al., 2013). Effective inland fisheries management is constrained by the need for more introductory information on ecology, population, fish diversity, and endangered species (Cooke et al., 2012). Overfishing of freshwater fish has been the cause of declining fish stocks over the last few decades (Hicks & McClanahan, 2012).
The results of this study indicate that fishing activities significantly impact the fish stocks in Widas Reservoir. Fishing mortality is more significant than natural mortality in the three major fish in Widas Reservoir, indicating less influence of water pollution, such as MPs. According to Zhou et al. (2020), MP is pervasive and will have a long-term influence on the worldwide ecology. Nonetheless, the waters of Widas Reservoir are safe for fish growth and human health since they are still utilized as a drinking water source, meaning that the potency of water pollution is minimal in the study area (Aida et al., 2018). Moreover, there have been no reports or indicators that fish taken in Widas Reservoir have been contaminated with MPs. However, water quality issues should be further reconsidered in the fishery-based assessment. MPs is currently in the spotlight. It is being studied extensively in aquatic habitats worldwide, particularly their impact within a reservoir where the water motion is weak.
Table 2 shows that fishing mortality (F) of Tawes/Minnows (B. gonionotus), Karper/Barbs (O. vittatus), and Nila/Cichlid (O. niloticus) in the Widas Reservoir was more significant than the natural mortality (M) and exploitation rate (E) is already overfishing, E > 0.5. These results are consistent with the assumption that a stock is optimally exploited when fishing mortality (F) equals to natural mortality (M), or E = (F/Z) = 0.5. If E > 0.5, it indicates that the fish resources have been overexploited.
The fishing mortality parameter of Tawes/Minnows was (F) = 3.54 year−1, and the exploitation rate (E) = 0.74. Since (E) > 0.5, it shows the overfishing status. With the Von Bertalanffy equation, the infinity length (L∞) of Tawes/Minnows fish (B. gonionotus) was 45 cm, which will be reached at the age of more than seven years. Fish that are frequently caught at a size of 18–25 cm are thought to be 1–1.5 years old (Figs. 2 and 3). The environment strongly influences the growth of Tawes/Minnows fish (B. gonionotus). For instance, compared to the Pondok Reservoir, with a smaller area of 407 ha and worse water quality, the growth of Minnows is under the value estimated in the Widas Reservoir, whereby the fish growth is more negligible, with (L∞) = 29 cm and K = 0.55 year−1 (Aida et al., 2022a).
According to King (2007), growth and death are influenced by ecological conditions. In general, the asymptotic difference in length (L∞) and growth coefficient (K) from one area to another can be caused by the availability of feed and water quality (Bartulović et al., 2004). Growth patterns are influenced by environmental factors, habitat, and food availability (Rahman et al., 2012). Several studies have shown that the parameters of the Tawes/Minnows fish population at each location differ due to different environmental conditions and the level of exploitation at each location. For example: Tawes/Minnows fish (Barbonymus schwanenfeldii) in Pedu Reservoir, Kedah Malaysia: (L∞) = 30.95 cm, growth coefficient K = 0.66 year−1, total mortality coefficient (Z) is 2.01 year−1, natural mortality coefficient (M) is 1.37 year−1, fishing mortality coefficient (F) is 0.64 year−1 and exploitation rate (E) = 0.32 (Isa et al., 2012). Tawes/Minnows fish in Nagan River, Aceh Province, L∞ = 16 cm, growth coefficient (K) = 0.73 year−1, total mortality (Z) = 2.80 year−1, natural mortality (M) = 0.92 year−1, (F) = 1.88 year−1, and exploitation rate (E) = 0.67 (Batubara et al., 2018).
Fishing activities for (B. gonionotus) in the Widas Reservoir cannot be more significant. The number of these fish needs to be a concern so that the population can stabilize and recover. The high level of exploitation of (B. gonionotus) in the Widas Reservoir is due to the relatively large size of the fish, which makes it easy to catch and has substantial economic value as fish consumption (Utomo et al., 2019).
The infinity length of O. niloticus (L∞) = 44.4 cm is estimated to have reached the age of more than 6.5 years. O. niloticus, often caught between 15–25 cm in size, is estimated to be 0.5–1 year old (Figs. 4 and 5). The exploitation rate (E) = 0.83, meaning that the exploitation rate of O. niloticus in Widas Reservoir is already overfishing (Pauly, 1984). The high exploitation rate of O. niloticus in the Widas Reservoir is due to the relatively large size of this fish, catchable, and essential economic value as a consumption fish (Aida et al., 2022b). However, O. niloticus has a strong tolerance for environmental quality degradation and is easy to breed over time, so the population is more stable than B. gonionotus.
The growth of O. niloticus is strongly influenced by the environment; for example, the Rawa Pening Reservoir is more expansive, with the worse water quality than the Widas Reservoir, resulting in a slower growth, with an indication of a smaller infinity length (L∞) = 35 cm (Aida & Utomo, 2016). O. niloticus in the Tamil Nadu Reservoir has an infinite length (L∞) of 38.7 cm (male) and 37.6 cm (female), growth coefficient (K) = 0.65 year−1 (male) and 0.73 year−1 (female), fishing mortality (F) = 2.4 year−1, the natural mortality (M) = 1.2 year−1 and the total mortality (Z) = 3.6 year−1, exploitation (E) = 0.67. O. niloticus in the Sri Lanka Reservoir has an infinity length (L∞) = 42.8 to 53.4 cm, growth constant (K) between 0.20 to 0.49 year−1, exploitation rate (E) between (0.14) to (0.76) (Bandara et al., 2020).
Based on the Von Bertalanffy equation, the infinity length (L∞) of Karper/Barbs fish (O. vittatus) was about 29 cm reaching the age of more than seven years. O. vittatus, often caught at a size of 10–15 cm, are estimated to be 0.5–1 year old. The maximum length (Lmax) of O. vittatus caught was 27 cm, estimated to be more than five years old (Fig. 9). Exploitation rate was 0.66 (overfishing) (Pauly, 1984). Therefore, fishing activities for O. vittatus should not be excessive.
The existence of O. vittatus should be a concern so they can grow and breed properly. The high exploitation rate of O. vittatus in Widas Reservoir is due to its significant economic value, often caught by lift nets whose mesh size is less than 1.5 inches. The growth of O. vittatus is highly influenced by the environment. For example, in Rawa Pening Reservoir, although it is expansive, with the worse water quality compared to the Widas Reservoir, the growth of O. vittatus is lower with an indication of a small infinity length (L∞) of 25 cm (Utomo et al., 2019).
According to RIFFE (2021), in general, fisheries exploitation in inland waters in Indonesia is already overfishing (E > 0.5), except in Lake Limboto Sulawesi because the lake is vast and oligotroph, with no significant fishing activities (Table 7). According to Bandara et al. (2020), Charernnate et al. (2021), Feroz Khan et al. (2021), Johnson et al. (2020), Moreau & Sricharoendham (1999); and Tesfaye et al. (2022), in general, fisheries exploitation in inland waters in several countries has been overexploited (E > 0.5) (Table 8).
| Location | Fish species | L ∞ (cm) | K (year−1) | M (year−1) | Z (year−1) | F (year−1) | E | References |
|---|---|---|---|---|---|---|---|---|
| Papua Island, Ayamaru Lake | B. gonionotus | 40.50 | 0.30 | 0.55 | 1.65 | 1.10 | 0.66 | RIFFE (2021) |
| O. niloticus | 26.50 | 0.30 | 0.75 | 2.99 | 2.24 | 0.75 | ||
| O. vittatus | 24.00 | 0.20 | 0.74 | 1.11 | 0.37 | 0.34 | ||
| Sulawesi Island, Limboto Lake | B. gonionotus | 32.00 | 0.36 | 0.90 | 1.32 | 0.42 | 0.32 | RIFFE (2021) |
| O. niloticus | 25.90 | 0.29 | 0.82 | 1.14 | 0.31 | 0.28 | ||
| Maluku Island, Batu Jai Reservoir | B. gonionotus | 27.00 | 0.41 | 1.06 | 2.19 | 1.13 | 0.52 | |
| O. niloticus | 31.00 | 0.55 | 1.23 | 2.66 | 1.43 | 0.54 | ||
| Kalimantan Island, Baritp River | B. gonionotus | NA | NA | 0.75 | 1.95 | 1.20 | 0.62 | RIFFE (2021) |
| O. niloticus | NA | NA | 1.24 | 2.87 | 1.63 | 0.57 | ||
| O. vittatus | NA | NA | 2.51 | 3.4 | 0.88 | 0.26 | ||
| Sumatera Island, Ranau Lake | B. gonionotus | 47.00 | 0.21 | 0.93 | 2.92 | 1.98 | 0.68 | RIFFE (2021) |
| O. niloticus | 36.00 | 0.17 | 0.51 | 0.84 | 0.33 | 0.40 | ||
| O. vittatus | 25.00 | 0.44 | 1.12 | 2.06 | 0.94 | 0.46 | ||
| Sumatera Island, Aceh Nagan River | B. gonionotus | 16.00 | 0.73 | 0.92 | 2.80 | 1.88 | 0.67 | Batubara et al. (2018) |
| Species | Location | L∞ (cm) | K (Year−1) | t0(Year) | M(Year−1) | Z(Year−1) | F(Year-1) | E | References |
|---|---|---|---|---|---|---|---|---|---|
| O. niloticus | Rajanganaya, Srilangka | 53.4 | 0.49 | –0.29 | 0.94 | 3.84 | 2.90 | 0.76 | Bandara et al. (2020) |
| Halali Reservoir, India | 46.73 | 0.63 | - | 0.60 | 1.5 | 0.72 | 0.48 | Johnson et al. (2020) | |
| Kelavarappalli Reservoir, Tamil Nadu | 38.7 | 0.65 | - | 1.2 | 3.6 | 2.4 | 0.67 | Feroz Khan et al. (2021) | |
| Lake Langeno, Ethiopia | 35.70 | 0.32 | –0.49 | 0.82 | 2.31 | 1.56 | 0.67 | Tesfaye et al. (2022) | |
| Barbonymus sp. (Minnows) | Kangkrajan Reservoir, Thailand | 36.2 | 0.39 | –0.28 | 0.93 | 2.44 | 1.51 | 0.55 | Charernnate et al. (2021) |
| O. vittatus | Rajjaprabha Reservoir, Thailand | 34.5 | 0.32 | - | 0.81 | 2,25 | 1.44 | 0.64 | Moreau & Sricharoendham (1999) |
Larger fish are generally detected in deeper layers of water, while smaller fish are found in the surface layer (Utomo et al., 2019). The fish size significantly shapes the TS. Simmonds & MacLennan (2005) stated that size is the dominant factor affecting the value of TS (TS). For the same fish species, the larger the fish size, the greater the TS value. The TS analysis may be more accurate if the relationship between TS and fish length is available. The most critical factor influencing acoustic estimates is the appropriate relationship between fish length and TS for a given fish population (Frouzova et al., 2005).
Simmonds & MacLennan (2005) stated that several other factors, including swimming bubbles, fish behavior, acoustic impedance, sound wavelength, beam pattern, fish species, and swimming speed, influence the TS value. Three other factors contributing to the vertical distribution of the target force were temperature 19.87%, salinity 12.61%, and depth 61%. In addition, disturbances from ships, such as ship movement and noise from generators and propellers, cause fish to avoid vessels (vessel avoidance) to the deeper water column (Fauziyah, 2010).
The behavior of the fish influences TS, the angle of the fish swimming to the hydroacoustic axis, and the angle is the angle of inclination or incidence. At night, when the fish creeps, the inclination angle approaches zero (Brooking & Rudstam, 2011). TS estimation experiments in cages have certain advantages in developing TS, as they are easy to carry out. For freshwater fish, it is easier to do TS experiments and freshwater fish can be adjusted so that their body position does not change, so it will be easier to research TS on fish (Mouget et al., 2019). Fish that do not move, for example, killed or stunned, are easier to test for TS.
Getting to the bottom of the water shows the increasing number of fish with greater TS. In general, larger fish were detected at deeper depths. This state relates to the differences in swimming layers for each size of fish. Larger fish tend to swim at a deeper depth than smaller fish. Some of the advantages in freshwater systems are that the sound emission from the transducer is more comprehensive, indicating lower susceptibility to noise and increased resistance to fish aspects (Kang & Hwang, 2003).
Based on the results of the bathymetry mapping carried out in June 2019, the depth of the Widas Reservoir ranged from 2 to 20 m. The deepest part of the Widas Reservoir (20 m) is situated in the middle of the reservoir and near the outlet. Meanwhile, a depth of 0.5–2 m is often found within the inlets. Fish biomass in the surface layer (1–5 m) is more significant than in the deeper layer by more than 15 m (Table 5) because the area and volume of water towards the bottom are getting narrower. The oxygen content is also lowered with the increase in the water depth. Oxygen is essential for fish and other biota, so fish biomass declines towards the bottom (Utomo et al., 2019). The shallow waters are generally located on the reservoir’s edge, with sufficient natural food for fish, especially aquatic vegetation, insects, periphyton, and others. Therefore, fish biomass is more abundant (Aida et al., 2022b). Freshwater fish generally spawn on the banks of rivers, reservoirs, and lakes during the rainy season. Aquatic plants such as grass on the shores of lakes/reservoirs are good places as nursery grounds for young fish (Djumanto et al., 2020).
Getting to the bottom of the waters, it is inhabited by fish detected with a higher dB (decibel) value (Table 4), and this is an indication that the deep waters are inhabited by large fish (Fauziyah, 2010). Many fish are in the surface layer because small fish mostly prey for plankton such as Wader (Rasbora), Karper (Osteochilus), and others (Ma’mun et al., 2022). Meanwhile, large fish such as Patin (Pangasius), Tapa (Wallago), Toman (Channa), and others require deep waters, especially during the dry season, such as the trough of the river (Utomo et al., 2019). Small fish, in general, often live in shallow reservoir borders because there is much aquatic vegetation, such as shelters and bays with calm waters, which are suitable habitats for fish. Pelagic fish migrate towards the surface at night and inhabit the surface column at night. Pelagic fish migrate to adapt to environmental factors such as temperature, salinity, and oxygen levels (Kaartvedt et al., 2007). The vertical distribution of fish in the lake is mainly affected by water temperature and oxygen stratification, but other factors, such as the risk of evading predation (Tsagarakis et al., 2015).
All exploitation rates (E) are more significant than 0.5, indicating overfishing (Table 6). Based on production data, fish catch in the Widas Reservoir reached 283,000 kg/year, while the TAC was only 216,973 kg/year, proving the overfishing state.
On the other hand, Cichlid fish dominate the Widas reservoir. These fish are easy to breed in various types of waters and even tend to be invasive. Native fish often cannot compete in breeding, competing for food and habitat (Syafei & Sudinno, 2018). Cichlid fish have significantly developed in Indonesian waters, especially reservoirs and lakes. Some research results show that Cichlid fish have dominated the reservoir waters. For example, in Gajah Mungkur Reservoir, the production of Cichlid catches reached 40%. In Sragen Regency, it reached 58.9%; in Cikoncang Reservoir, it reached 58.5%. Cirata Reservoir reached 53%; Pondok Reservoir reached 76% (Aida et al., 2018).
After obtaining the value of fish stocks, population parameters, and TAC, it is expected to be a reference material for fish resource management policies in Widas Reservoir. There are already indications of overfishing, so fishing activities must be reduced, especially gillnet and lift net, which are more numerous. Lift-net is a non-selective fishing gear in East Java and Central Java, and the number continues to increase in almost all reservoirs. Many gillnets used by fishers are also not selective in the size of their nets under 2 cm, so the fish that have not spawned have been caught significantly. There are many fishing activities at the reservoir inlet at the beginning of the rainy season and fish spawning ground at the beginning of the rainy season. It is necessary to introduce closed seasons or protected areas at the inlet of reservoirs (Aida et al., 2018).
In addition to regulating fishing and conservation, fish stocking must be carried out continuously. Restocking fish from hatcheries (culture–based fisheries, or CBF) is one approach to increase capture fisheries yields; CBF should be implemented in Indonesia using local species (Utomo et al., 2019). A Reservoir is a good body of water for restocking because reservoirs have clear boundaries that make them easier to manage (Aida et al., 2022b). The stocking of fish should be convinced that there is a compatibility between the fish and its aquatic environment, a spawning habitat, enough natural food available, and fishing rules; if necessary, a conservation area is created (Utomo, 2016). Future research needed in Widas Reservoir is to support restocking, conservation, and fishing rules so that fish populations in Widas Reservoir can increase (Utomo & Aida, 2017).
Conclusion
The fish stock in Widas Reservoir is 79,848 kg and is dominated by Cichlid species. The stock gradually declines with the increase in water depth. The fish stock in the surface layer at a depth between 1–5 m is 58,813 kg, while in the deeper layer (> 15 m), the stock only reaches 1,219 kg. Based on the analysis of the dominant fish growth parameter data in the Widas Reservoir, the indication of overfishing is possible since the exploitation rate value was generally more than 0.6. The overfishing state is proven by the significantly higher catch production than TAC, with a deviation of 66,017 kg/year in the Widas Reservoir.
It is necessary to regulate fishing in the Widas Reservoir so that the catch does not exceed the TAC. Fishing activities must be more controlled, mainly controlling the usage of gillnet and lift nets with mesh sizes of less than 2 inches, which have been increasing recently. In addition to the fish population, it is necessary to restock the native fish, such as B. gonionotus, and O. vittatus, for sustainability. A further assessment of fish restocking, conservation, and decision-making is necessary to recover the fish population and control the overfishing issue.

