Introduction
Farmed Nile tilapia (Oreochromis niloticus) is one of the most popular aquaculture fish. It has become an important protein source in many countries around the world (Al-Harbi & Uddin, 2005). Tilapia farming is expanding in many regions of the world, with the global tilapia production growing continuously in recent years (El-Sayed & Fitzsimmons, 2023). The worldwide production of tilapia increased every year, specifically 6.5 million tons in 2019 and 6.93 million tons in 2020 (FAO, 2020). The average production growth of tilapia from 2010 to 2019 worldwide was estimated to be at 7.7%. China is the leading tilapia producer in the world, with an output accounting for nearly 50% of the total world production. Other countries with high tilapia exports are Indonesia (e.g., 1.1 million tons in 2019) and Egypt (e.g., 0.9 million tons in 2019; Ragnar et al., 2019). Recently, Vietnam has developed farmed Nile tilapia, which is present at various outlets, such as supermarkets, grocery stores, or traditional open markets under ice storage or chill conditions of refrigerators. Fish products might be cross-contaminated during transportation, retail display, or purchase. The microbial growth in seafood cause negative effects on the quality and food safety. The most prominent and common microbes in seafood are specific spoilage organisms (SSOs) such as Pseudomonas spp., Photobacterium phosphoreum and Shewanella putrefaciens (Gram & Dalgaard, 2002). These microorganisms, when grown, produce low-grade products, reducing the quality of aquatic products (Zhang et al., 2011). Temperature and time have been known as the most significant factors influencing the microbiological growth in foods. Increasing temperature to a certain limit will advance microbial counts, accelerating fish spoilage. Therefore, modeling the evolution of SSOs, considering temperature and time allows scientists to predict the SSO development during processing and storage accurately (Ogidi et al., 2021). Kinetics models are currently considered a reliable information channel, helping to predict the development of spoilage microorganisms and estimate the remaining shelf life of aquatic products in the cold chain. The predictive ability of the models is evaluated under real-world conditions (Ghimire & Sapkota, 2020). There are many studies that have used kinetic modeling to evaluate changes in quality and predict the remaining shelf life of different types of seafood, including frozen arrow squid and blue shark slices (Giannoglou et al., 2014), frozen shrimp (Tsironi et al., 2009) and modified atmosphere packed fillets of gilthead seabream (Tsironi et al., 2011). Among several models used to describe the growth of microorganisms, such as Logistics regression, Gompertz model, Baranyi model (Tarlak, 2021), the Baranyi & Roberts model is widely applied in microbial research thanks to its simplicity and outstanding significance in terms of biological aspect (Xing et al., 2012). This study aimed to determine mathematical models of the development of SSOs in tilapia (O. niloticus) fillets at cold chain downstream conditions.
Material and Methods
Nile tilapia fish was filletted, and then frozen by an individual quick freezing (IQF) steel belt freezer at the environment temperature of –35°C to –40°C at a seafood producer in the Mekong Delta, Vietnam. Frozen fish fillets, weighing 120–170 g each, on the day of processing were topped with gel mats in 30 kg expanded polystyrene (EPS) boxes and tightly covered with lids. Fish in boxes were then transported to the laboratories of Nha Trang University (Vietnam) within 16 h. Upon arrival, fillets were put into polyamide (PA) packs and kept at –20 ± 2°C for further study (Diem et al., 2018).
On the day of the chilled storage study, Tilapia fillets were thawed, packed into polystyrene trays, covered with thin polyethylene film, and stored at designed temperatures. Tilapia fillets were stored at eight stable temperature regimes, namely, 1 ± 1°C for 13 days, 4 ± 1°C for 10 days, 9 ± 1°C for 8 days, 15 ± 1°C for 119 h, 19 ± 1°C for 80 h, 25 ± 1°C for 69 h, 29 ± 1°C for 24 h and ambient air (30°C–33,5°C) for 16 h. There were also 2 dynamic temperature conditions, simulating the end of the supply chain:
Dynamic temperature regime 1 was composed of alternative temperatures of 1 ± 1°C (imitating cold storage room conditions of supermarkets) and 19 ± 1°C (open display areas of retailler stores) for 168 h with temperature shift every 4–6 h at daytime and/or 8–10 h at nighttime.
Dynamic temperature regime 2 was made similar to the conditions of transportation from processing plants to distributors (4 ± 1°C), at retail cabinets (9 ± 1°C), and temperature fluctuation when the end customers took products out of display cabinets (15 ± 1°C). Total storage time and temperature change points were similar to dynamic regime 1.
In each temperature mode, 9 sample points were taken to determine bacterial loads (Diem et al., 2018). The temperature of fish fillets and the storage medium were continuously monitored using DS1922L-F5 iButton® self-recording thermometers (Maxim Integrated, San Jose, CA, USA) and MicroLogPRO II EC850A (Fourtec, ROSH HAAYIN, Central District, Israel). Microbial data at stable temperatures were used to build the primary and secondary models. Microbial data and temperature history were used to test the predictive power of the models.
Samples and dilution series’ preparation: Samples of 25 g of tilapia fillets were homogenized with 225 mL phosphate buffer solution for 2 min. From this first dilution, other decimal dilutions were prepared.
Determination of total viable counts (TVC) of cold-tolerant bacteria according to NMKL 86:2006: 0.2 mL of each sample at three continuous appropriate dilutions were transferred into petri dishes containing 15–20 mL of sterile plate count agar medium.
Determination of Pseudomonas spp. counts according to TCVN 7138:2013: 0.2 mL of each sample at three continuous appropriate dilutions were transferred into petri dishes containing 15–20 mL of Pseudomonas Base medium with sterile Pseudomonas CFC supplement.
Incubation was carried out at 20°C for 5 days. Petri dishes containing colonies from 25 to 250 were selected for numeration.
Baranyi & Roberts model: the Baranyi & Roberts model was used to fit the microbial growth at constant temperature conditions (Baranyi & Roberts, 1994).
in which:
y is the decimal logarithm of bacterial counts at time t (log CFU/g);
y0 is the decimal logarithm of initial bacterial counts (log CFU/g);
ymax is the decimal logarithm of maximum bacterial counts (log CFU/g);
μmax is the maximum specific growth rate (1/h);
λ is the lag time (h);
q0 represents physiological state of the bacterial cells;
h0 is considered as a statically stable transformation of q0 (h0=λ.μmax)
Secondary model for microorganisms in food: The secondary model is to estimate the microbial growth under an unstable environment which includes pre-culture and culture conditions.
In the case of the Baranyi & Roberts model, Equation (1) is applied for modeling the bacterial growth under fluctuating conditions. Only 2 parameters of the model are of interest, namely the maximum growth rate (μ0) and maximum bacterial count Nmax or ymax = lnNmax. The initial counts of bacteria is considered as the inital value which is a constant during the simulation of fluctuating conditions.
When temperature is the only changing environmental variable, while other factors are regarded as constants, the growth rate can be modeled by the Ratkowsky square root model:
in which:
T is the temperature (°C)
Tmin is the minimum temperature for the microbial growth (°C)
b is the regression coefficient (°C−1 h−1/2).
Microsoft Excel version 2010 (Redmond, WA, USA) was used to calculate average values and standard deviations and to build charts.
Analysis of variance (ANOVA) with Post-hoc Tukey was conducted in SPSS version 17.0 for mean comparison with a 0.05 significance level.
Parameters of the primary models were estimated using the DMFIT software on ComBase website (https://browser.combase.cc/DMFit.aspx).
ColdChain software, a product from a Chinese-Vietnamese Bilateral Project entitled “Research Collaboration, Development of Monitoring System Using Wireless Sensor Network for Quality Control and Energy Saving in Aquatic Product Cold Chain (Contract no. 08/2014/HÐ-NÐT)” was used to find the parameters of the secondary models and to predict the microbial counts based on time-temperature records.
Results and Discussion
Experimental data from Nile Tilapia fillet samples stored at constant temperatures were applied to the Baranyi & Roberts equation to describe the growth kinetics at different temperatures.
Fig. 1 describes the parameters of the primary models for the growth of TVC and Pseudomonas spp., built based on the model of Baranyi & Roberts.
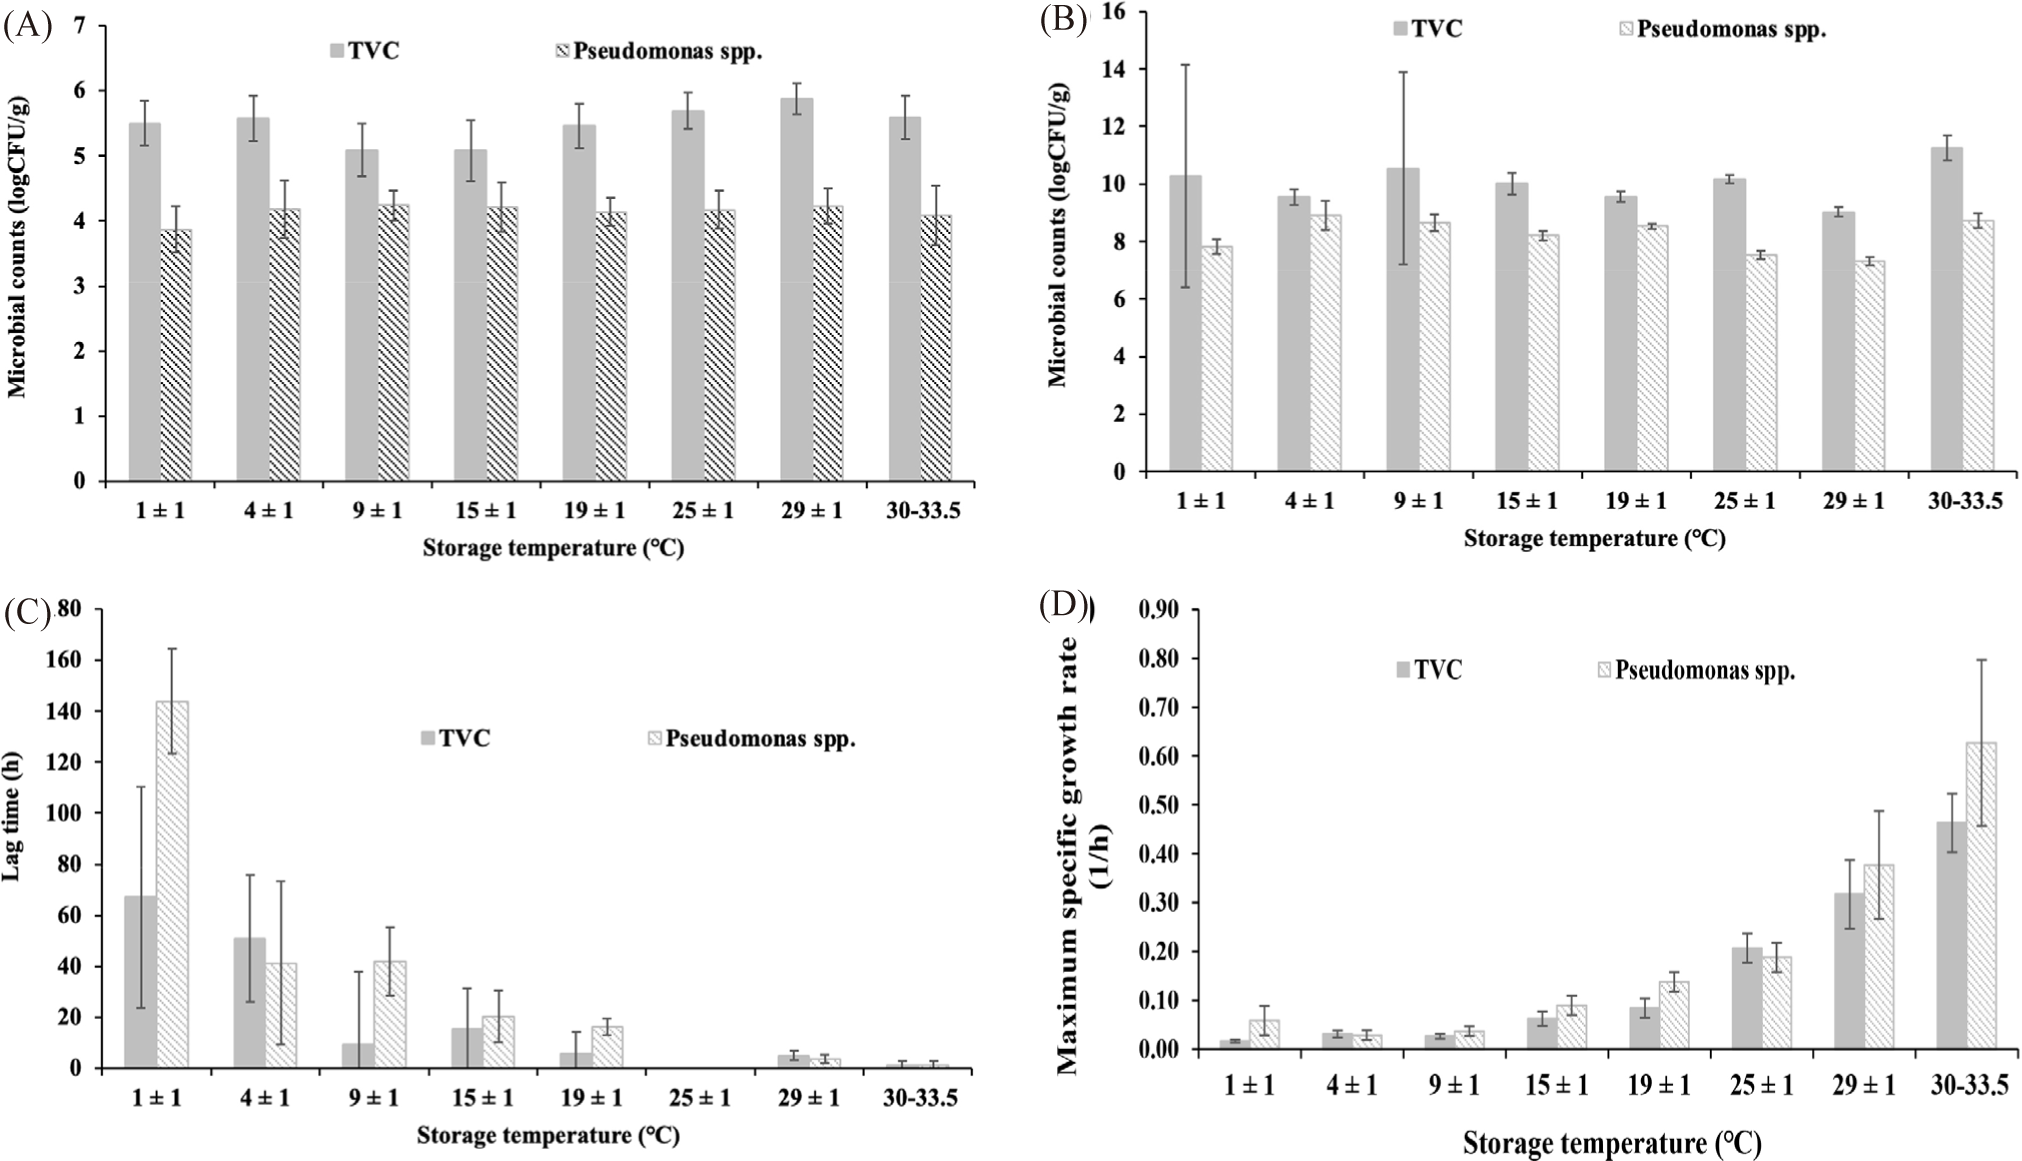
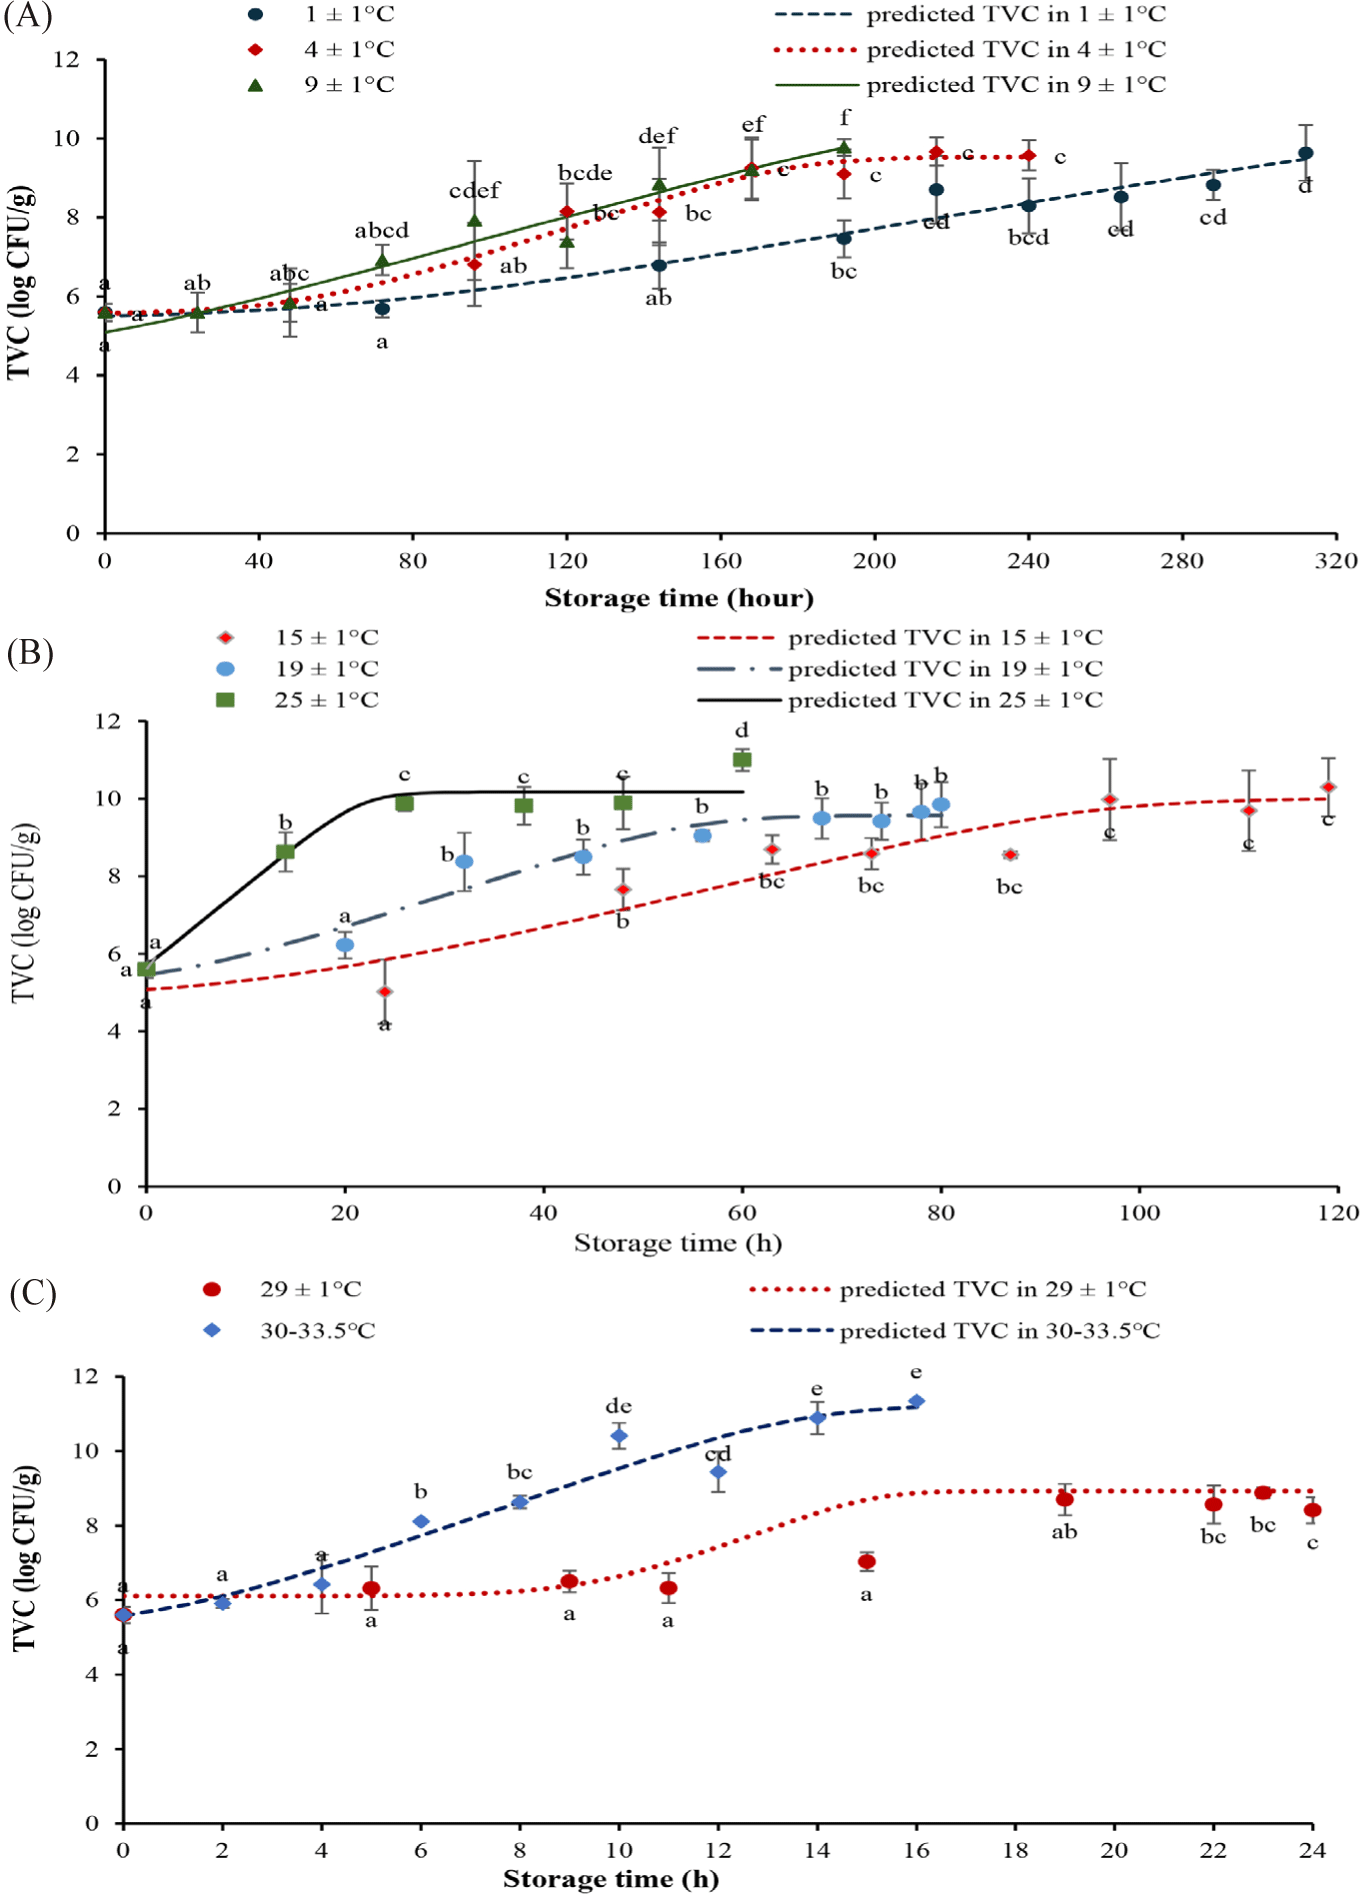
The starting TVC (Y0) was estimated to be from 5.50 to 5.59 log CFU/g (Fig. 1A). At all stable temperature conditions, TVC increased to reach the peak of 9.03–11.26 log CFU/g (Ymax; Fig. 1B). The growth rate (μmax; Fig. 1D) of the TVC at 1 ± 1°C was 0.02 (1/h) and up to 0.46 (1/h) at ambient temperatures of 30°C–33.5°C. The duration of the lag phase (λ; Fig. 1C) decreased from 67.05 ± 43.45 h at 1 ± 1°C to 1.4 ± 1.38 h at 30°C–33.5°C. The lag time decreased as the storage temperature rose. The bacterial growth rate came up rapidly under favourable conditions. The TVC in tilapia fillets when stored at 20°C and 25°C increased faster than at 15°C and 10°C (Tran et al., 2019). Temperature is one of the most notable factors influencing the growth rate and lag phase of microorganisms in food systems (Huang, 2008). The findings agreed with those for other foods. For example, the chickens stored at 4°C–15°C had an initial TVC (Y0) of 5.12 ± 5.67 log CFU/g, after 10 days of storage, the maximum TVC (Ymax) was 9.84 log CFU/g. The growth rate of TVC in tilapia fillets of this study is consistent with the growth trend of TVC in Psetta maxima stored at 0°C–15°C (Nuin et al., 2008) and in Pangasius fillets at 0°C–19°C (Mai & Huynh, 2017). The maximum growth rates at 1 ± 0.5°C of TVC in tilapia fillets pretreated with 5 ppm Chlorine and with 20 ppm Chlorine and 1% NaCl were 0.042 (1/h) and 0.040 (1/h), respectively (Fonseca et al., 2013). Based on the national allowable TVC limit of 6 log CFU/g, the shelf life of tilapia fillets were 144, 96, 72, 48, 20, 14.5 and 4 h of storage at 1 ± 1°C, 4 ± 1°C, 9 ± 1°C, 15 ± 1°C, 19 ± 1°C, 25 ± 1°C, 29 ± 1°C and ambient temperatures 30°C–33.5°C, respectively (Fig. 2).
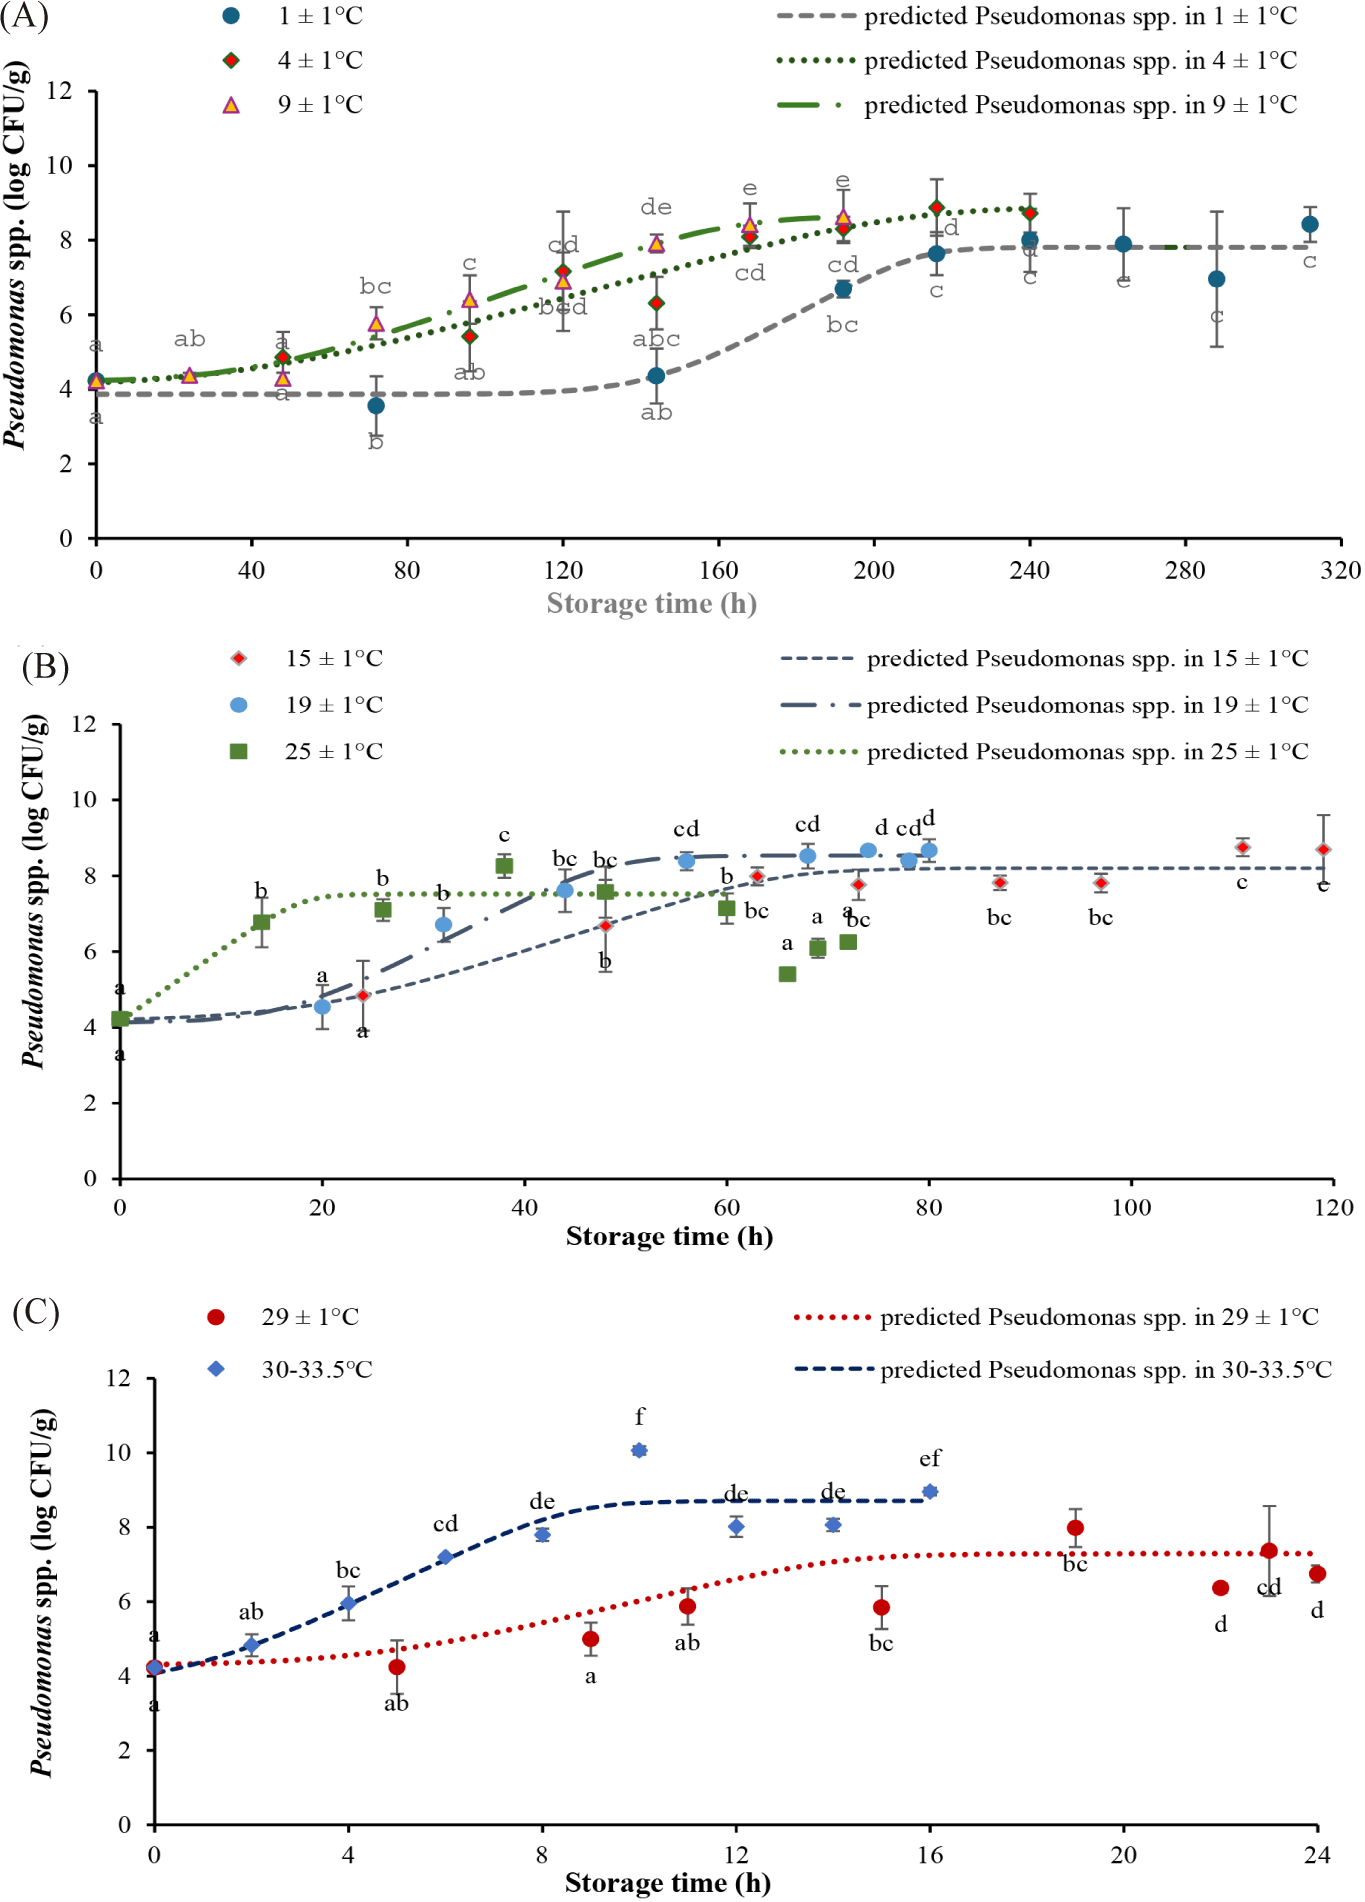
The proliferation rate of Pseudomonas spp. increased with storage temperatures (Fig.1). Specifically, it was only 0.06 (1/h) at 1 ± 1°C, but amounted to 0.63 (1/h) at 30°C–33.5°C. The lag phase shortened as the temperature increased, from 143.79 ± 20.57 h at 1 ± 1°C to only 1.13 ± 1.61 h at ambient temperatures. Particularly, there was no lag time at 25 ± 1°C, which might be around the optimum conditions for the proliferation of Pseudomonas spp. (Chakravarty & Gregory, 2015). The results were very similar to other studies. For example, the lag phase of Pseudomonas spp. in chilled beef decreased from 104.36 h at 0°C to 2.44 h at 20°C, meanwhile the growth rate elevated from 0.0299 ± 0.0027 (1/h) at 0°C to 0.1795 ± 0.00963 (1/h) at 20°C (Tarlak, 2021). The maximum growth rate of Pseudomonas spp. (μmax) in beef stored at isothermal temperatures of 0°C–20°C was 0.034 ± 0.007 (1/h) at 0°C and increased to 0.127 ± 0.008 (1/h) at 20°C, and the lag phase decreased from 8.41±19.9 h at 0°C to 0.4 ± 1.9 h at 20°C (Tarlak, 2021). At 0°C–15°C, the growth rate of Pseudomonas spp. in chicken meat was 0.096 to 0.528 (1/h) and the lag time was 74.3 h to 2.7 h (Ghollasi-Mood et al., 2016). The lag time of Pseudomonas spp. in Sparus aurata dropped from 37.2 ± 5.9 h at 0°C to 8.10 ± 0.6 h at 15°C, while the growth rate elevated from 0.054 ± 0.0002 (1/h) at 0°C to 0.269 ± 0.026 (1/h) at 15°C (Koutsoumanis, 2001).
The number of Pseudomonas spp. started at 4.22 ± 0.11 log CFU/g and escalated with the same trend as TVC. At the end of the storage time, the amount of Pseudomonas spp. was 8.42 ± 0.46 log CFU/g, 8.72 ± 0.52 log CFU/g, 8.64 ± 0.71 log CFU/g, 8.69 ± 0.91 log CFU/g, 8.67 ± 0.29 log CFU/g, 6.25 ± 0.07 log CFU/g, 6.74 ± 0.09 log CFU/g, and 8.96 ± 0.23 log CFU/g at 1 ± 1°C, 4 ± 1°C, 9 ± 1°C, 15 ± 1°C, 19 ± 1°C, 25 ± 1°C, 29 ± 1°C, and 30°C–33.5°C, accordingly (Fig. 3). At the time of expiration of the tilapia fillets based on the TVC criteria, the Pseudomonas spp. loads ranged from 4.35 to 5.96 log CFU/g.
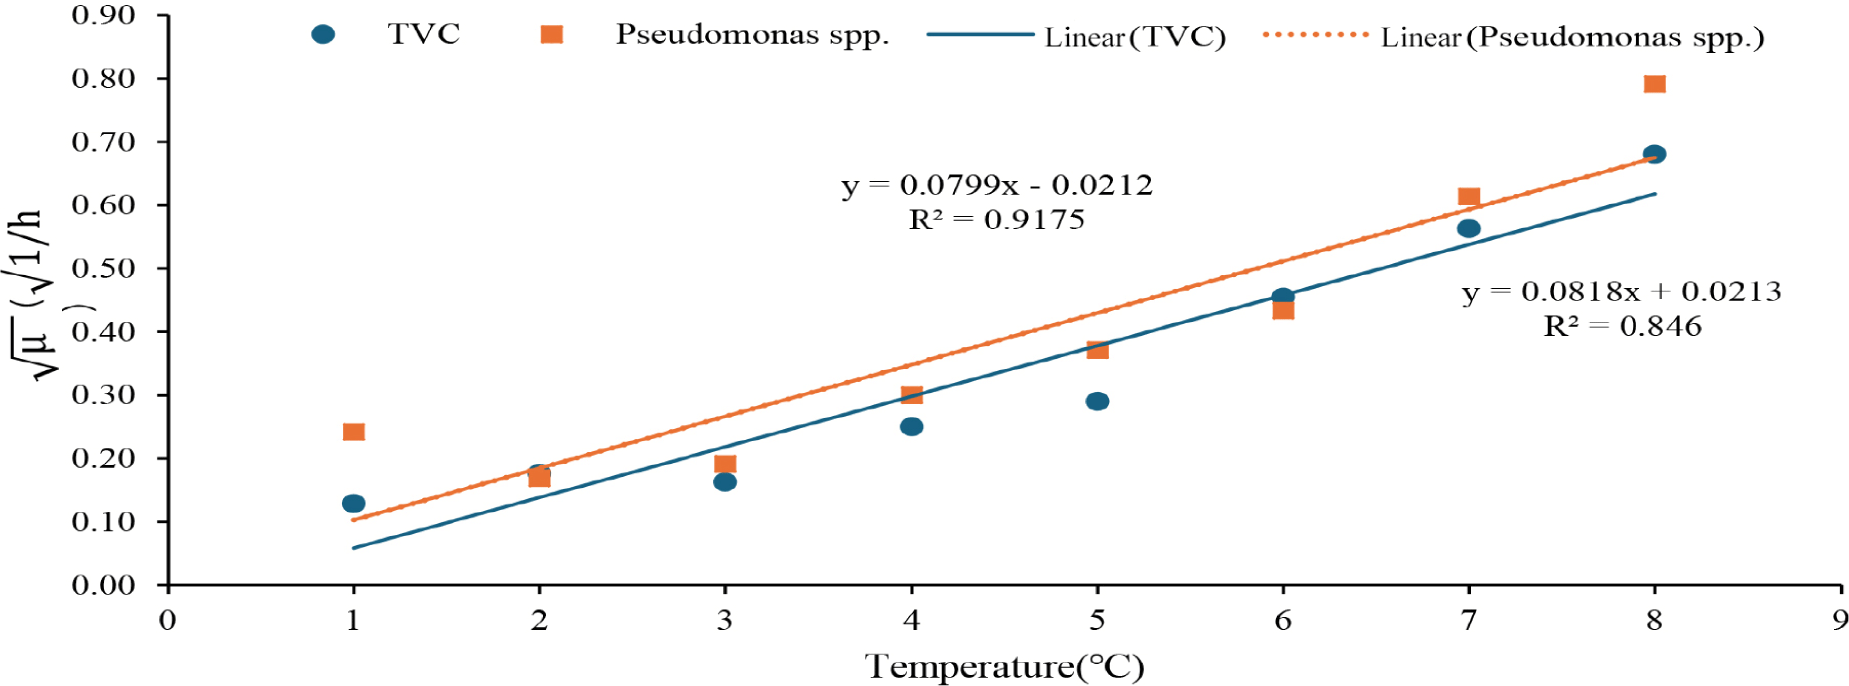
The secondary model showed that TVC had a minimum growth temperature (Tmin) of 0.23 ± 0.05°C and b of 0.015 ± 0.002 (°C–11 h–1/2), while those of Pseudomonas spp. were 6.48 ± 19.92°C and 0.016 ± 0.004 (°C–11 h–1/2), respectively (Table 1). These results were similar to previous studies. For example, the growth of TVC on black tiger shrimp had Tmin = –4.403°C and b = 0.027 ± 0.07; Pseudomonas spp. had the value Tmin = –3.549°C and b = 0.029 ± 0.08 (Nga & Van, 2021). For the growth of TVC in chicken meat at 4°C–15°C, the model parameters were Tmin = –6.2°C and b = 0.024 ± 0.004 (Lytou et al., 2016). For Pseudomonas spp, in tropical shrimp (Penaeus notialis) at 0°C–28°C, the model parameters were Tmin = –12.1°C and b = 0.019 (Dabadé et al., 2015). In chilled stored Pangasius fillets, the parameters of the square root model were Tmin = –10.88 ± 1.39°C and b = 0.011 ± 0.001 for TVC; Tmin = –13.37 ± 1.19°C and b = 0.145 ± 0.013 for Pseudomonas spp. (Mai & Huynh, 2017).
| b (°C–1 h–1/2) | Tmin (°C) | R 2 | |||
|---|---|---|---|---|---|
| Mean | STH | Mean | STH | ||
| TVC | 0.015 | 0.002 | 0.23 | 0.05 | 0.91 |
| Pseudomonas spp. | 0.016 | 0.004 | 6.48 | 19.92 | 0.83 |
The value of the coefficient of determination (R2) was relatively high, 0.91 for TVC and 0.83 for Pseudomonas spp. (Fig. 4), indicating the feasible application of the models in estimating the TVC and Pseudomonas spp. counts based on the temperature history.
Most microorganisms grow better in the temperature range from 4°C to 60°C. At these temperatures the growth rate will increase rapidly (Vaikousi et al., 2009). Besides, TVC is one of the most important criteria to evaluate the quality of aquatic products (Chouhan et al., 2015), therefore TVC was used as the target microbes for practical control during storage of tilapia fillets.
The shelf life of tilapia fillets stored at fluctuating temperature regimes 1 and 2 should not exceed 32 and 22 h, correspondingly, when the TVC surpassed the threshold of 6 log CFU/g (Figs. 5 and 6). At dynamic temperature regime 2, the TVC started at 5.55 log CFU/g and went up to 11.32 log CFU/g after 168 h. There was a rapid rise in the TVC after 22 h, and the load at 50 h reached 7.45 log CFU/g, superior to the allowable limit. Temperature fluctuations during storage, preservation, distribution, and transportation can all affect product quality because the speed of chemical, biochemical, and microbiological reactions is related to temperature. This affects food safety during cold storage in the supply chain (Casanova et al., 2022).
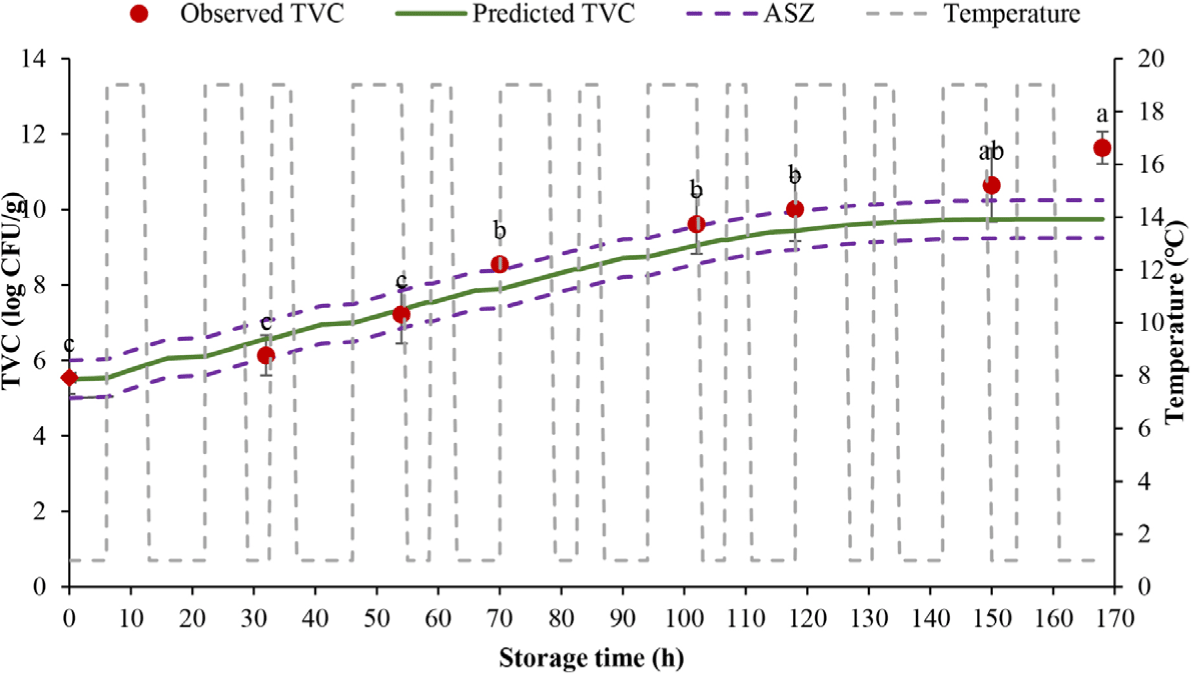
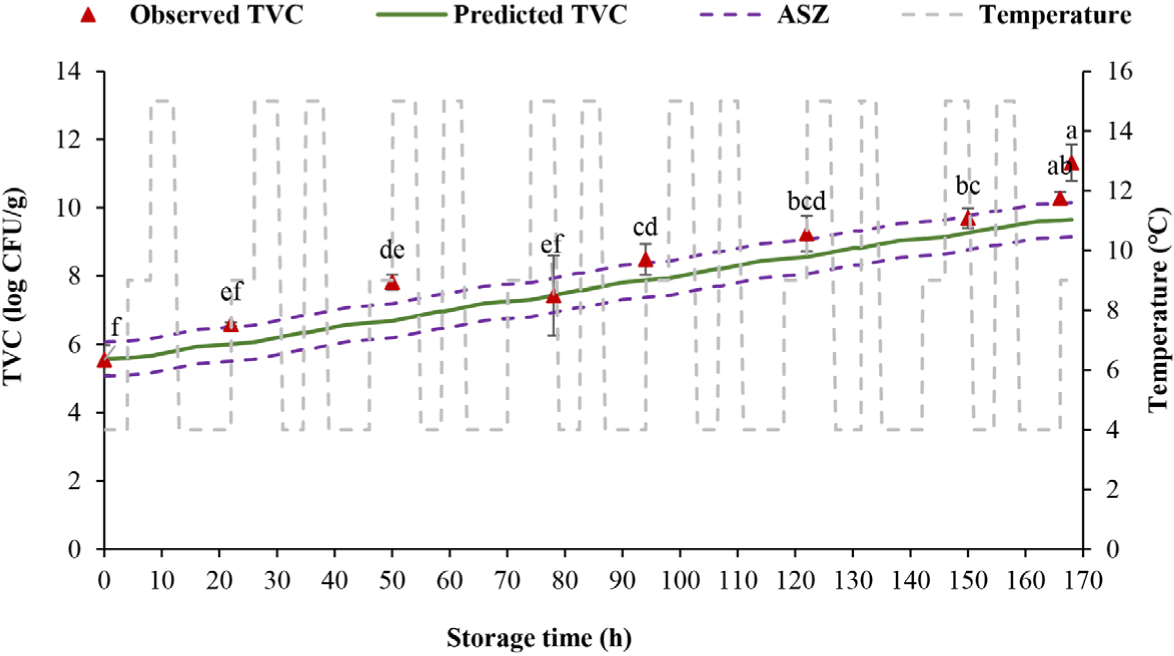
Six out of 8 (75%) of measured TVC were within the acceptable simulation zone (ASZ; which includes ± 0.5 log CFU/g areas around the predicted line) at dynamic temperature regime 1, while 7/9 observed TVC (77.78% of the values) fell within the ASZ at dynamic temperature regime 2. The model is regarded as reliable if at least 70% of observed values are within the ASZ (Martinez-Rios et al., 2016; Nga & Van, 2021; Østergaard et al., 2014). In the prediction of the TVC in black tiger shrimp during the cold supply chain, 11/14 observed data (78.57%) were in the ASZ, and 3/14 samples (14.23%) outside the projection region were in the “false safe” prediction area (Nga & Van, 2021). In other studies, 83% determined numbers of Listeria monocytogenes in cheese (Østergaard et al., 2014) and 78% measured counts of psychrotolerant Pseudomonas spp. in milk were within the ASZ (Martinez-Rios et al., 2016). The findings of this research proved that the established models were reliable to use in predicting the TVC, thus the shelf life of tilapia fillets based on the TVC margin.
Fig. 7 reveals a rising trend in the TVC during storage. The TVC initiated at 5.45 log CFU/g, increased over storage time and reached 6.39 log CFU/g after 22 h of storage. After 7 days (168 h), the TVC was extremely high (11.71 log CFU/g).
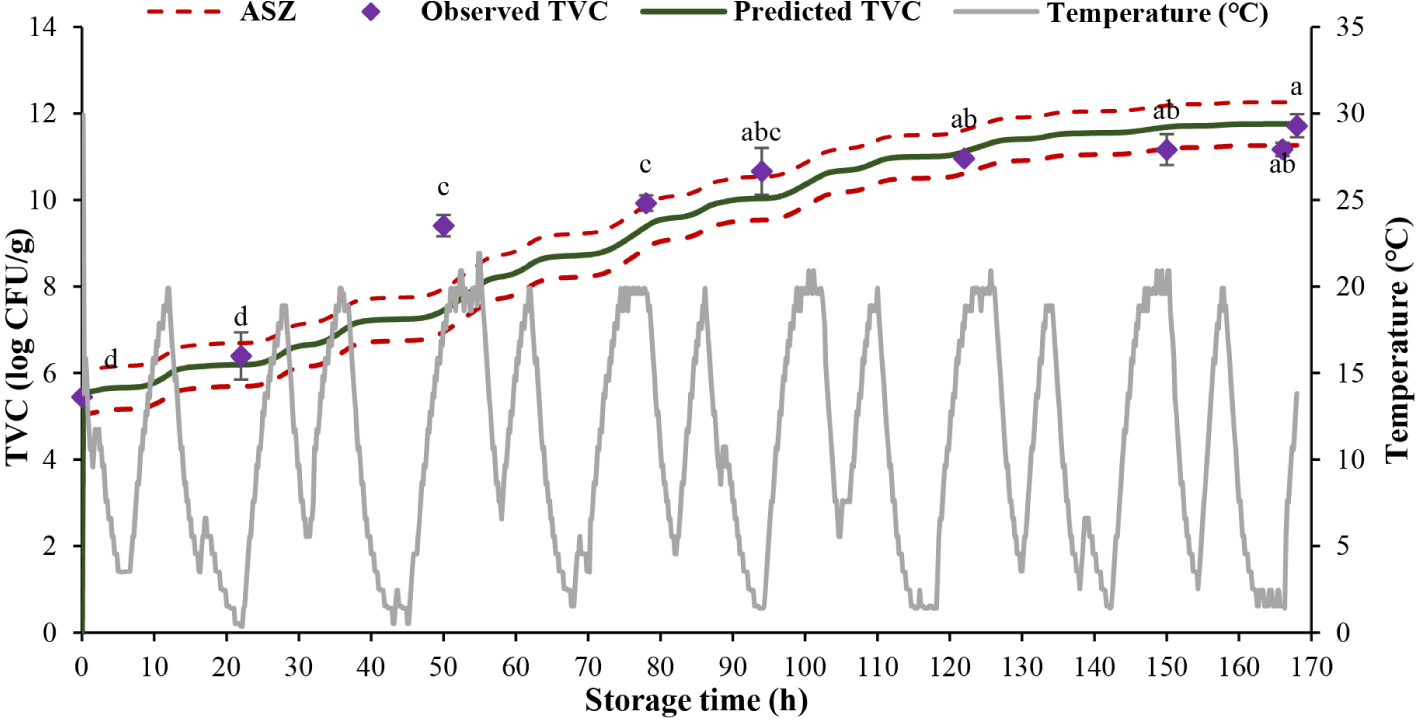
Eight out of 9 values (88.89%) of actual TVC were within the prediction range (ASZ) and only 1 value (11.11%) of observed TVC was in the “fail-safe” zone. The results of previous studies showed that 85% of TVC and Pseudomonas spp. loads in Pangasius fillets recorded in the ASZ (Mai & Huynh, 2017), about 83% of L. monocytogenes counts in fresh cheese lied within the ASZ (Østergaard et al., 2014).
Our findings showed the efficient application of the kinetics models for bacterial growth in tilapia fillets at the cold supply chain end. Based on the elapsed storage temperature, the TVC of Nile tilapia fillets could be predicted at any point of time in the chain downstream, enabling the prediction of a safe storage time of tilapia fillets. The developed models might also be helpful for food stakeholders in managing their product quality in a faster, more accurate, and cost-effective way.
Conclusion
According to research results, microorganisms increase rapidly when storage temperature is violated, TVC exceeds the prescribed threshold of 6.39 log CFU/g after 32 h of storage. After 7 days (168 h) of tilapia fillet storage, the TVC was extremely high, reaching 11.71 log CFU/g. Based on the changes in bacterial counts over time observed at different stable temperatures, the growth models for the cold-tolerant aerobic bacteria and Pseudomonas spp. were developed, with the relatively high value of R2. Model validation at dynamic temperatures of imitated and real-life conditions supported the possible implementation of the models in predicting the bacterial counts on the ground of temperature records, helping to identify the shelf life of products during supply chains.
