
Introduction
Freshwater hosts various aquatic biodiversity such as fishes and macroinvertebrates, their habitats, and the interaction between them (Dorji & Gurung, 2017). Although Bhutan is part of one of the biodiversity hotspots of the world, the freshwater diversity of Bhutan is underexplored or not documented in detail (Gurung et al., 2013). Nonetheless, development activities and poachers’ practice of setting fish traps along the river Pho chhu and other major tributaries of Punatsang chhu pose threats towards various fish species (Dorji, 2016).
Among several species of fish found in Bhutan, two species of ecological significance found in Punatsang chhu are the Snow trout (S. richardsonii) and Brown trout (S. trutta). Snow trout belongs to the family Cyprinidae and Brown trout to Salmonidae, which are known to coexist in major rivers of Bhutan. Snow trout has been on a decline over the last 5 to 10 years and is assessed as vulnerable (Vishwanath, 2010). However, no ecological assessment of both Snow trout and Brown trout has been conducted in Bhutan to date, although records of their presence have been documented from different rivers of Bhutan (Dorji & Gurung, 2017; Gurung et al., 2013; UWICER, 2017).
Punatsang chhu basin is earmarked for massive multiple hydropower construction which will fragment the river habitat, alter watercourses and modify river flow. This will have adverse consequences on the biology and survival of fish in the river (Dorji, 2016). Brown trout is an exotic species that was introduced in Bhutan in 1940 (Gurung & Thoni, 2015). Worldwide, its introduction is known to harm native species (Lobón-Cerviá, 2017). It is often assumed that due to their different morphological features and unique resource partitioning niche, these fishes do not compete with each other for food in the same water body. However, as the Brown trout is carnivorous, it alters the macroinvertebrate base, which can be damaging to the river ecosystem wherever it is introduced (Maia & Valente, 1999). While many countries where Brown trout have been introduced have reported an adverse impact on the native aquatic fauna (Belica, 2007), there are virtually no records of such studies conducted in Bhutan.
In line with the fact that scarce studies have been conducted on these species in Bhutan, an assessment of the habitat of these species is essential in terms of a conservation perspective. The existence of both species in the same habitat range has indicated a presence of competition and as per Thapliyal et al. (2016), Brown trout has been dominating when it comes to resource competition. The invasive nature of the Brown trout has its roots in the encroachment of the habitat of other native species and altering the dynamics of the population in the river basin. The study aims towards highlighting the habitat preferences, distribution, and population dynamics of the two species in Punatsang chhu river basin and understand the competition between these fish species and population structure. This will help in understanding the impact had by the invasive species on the native species in the same river basin.
Materials and Methods
The study area, Punatsang chhu river is located between 26.42–28°N, 89.20–90°E, and stretches to a length of 250 km (UWICER, 2018). Average annual rainfall in Punatsang chhu varies from 400 to 600 mm upstream, 700 to 900 mm midstream, and more than 2,000 mm downstream (Dorji, 2016). The lowest elevation of the basin ranges from 200 meters above sea level (masl) to the highest of 6,500 masl. The stretch of the river sampled started from Punatsang chhu, at about the dam construction (27°25’15”N and 89°54’18”E), with a fixed distance between each plot until the required stretch was covered. The major and minor tributaries were also included in the study (Fig. 1).
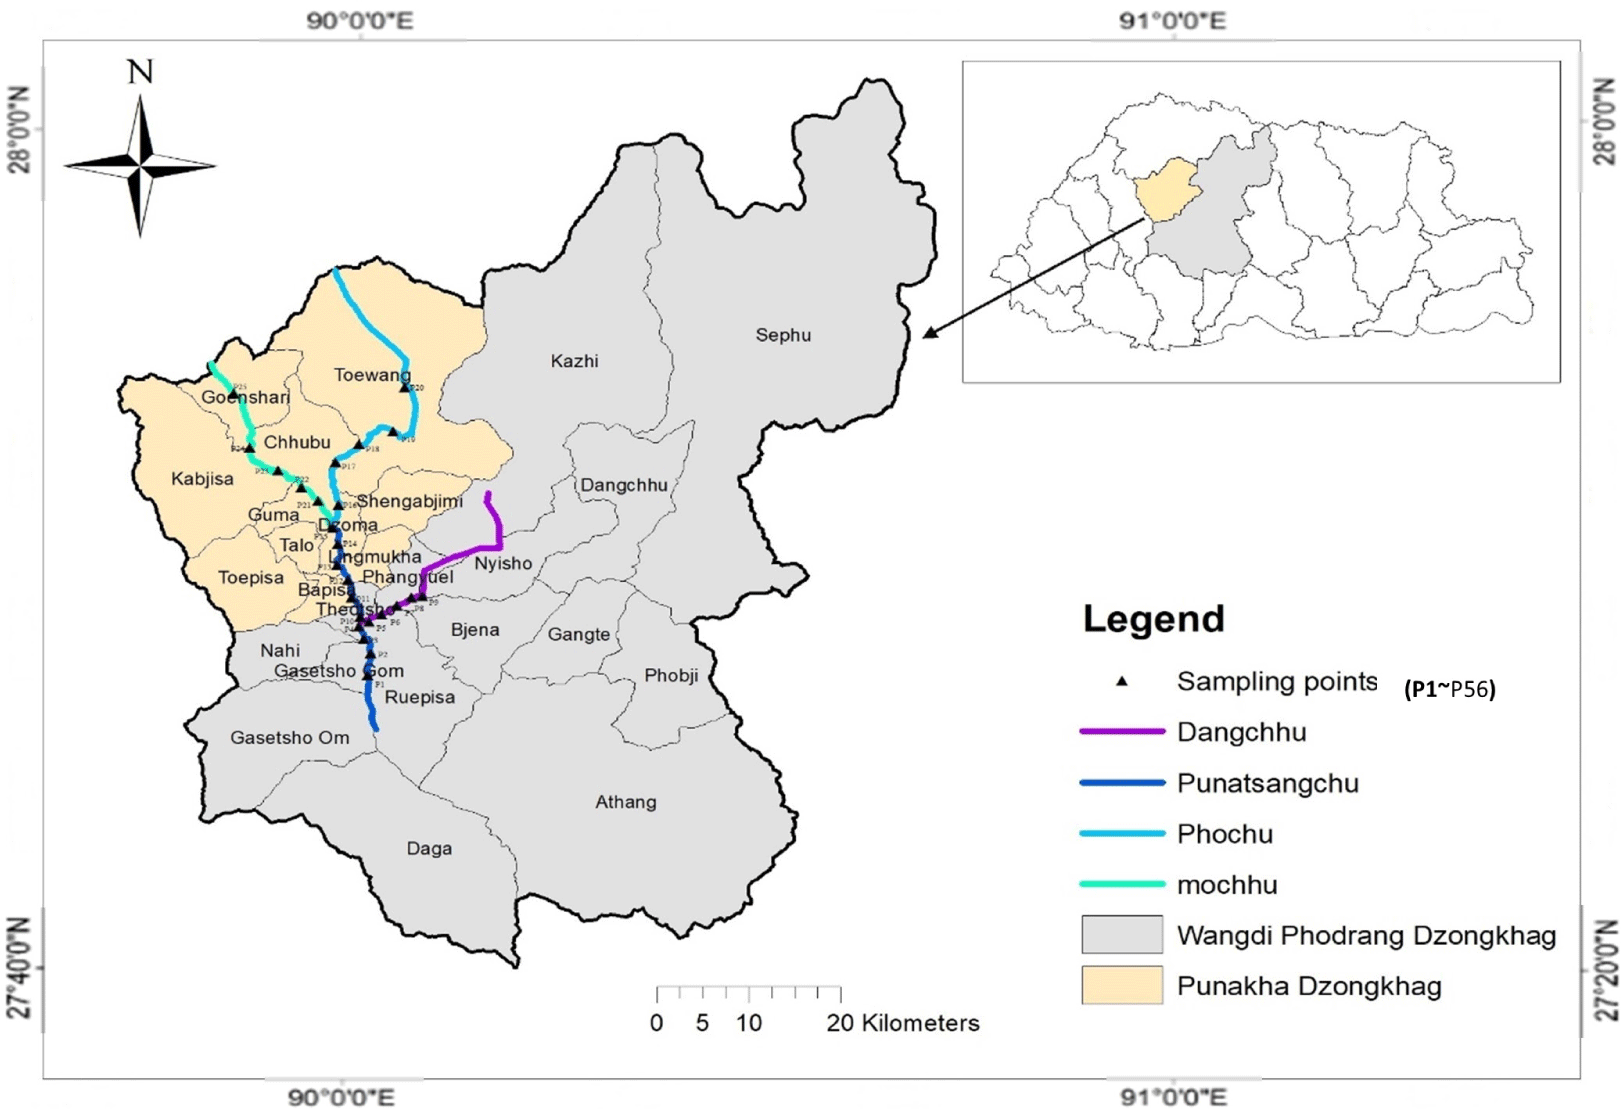
Field samplings, for the two trout species, were conducted during February, as these fishes are cold water species. A total of 56 plots were sampled and replicated in April to reduce the sampling error. The sampling was conducted along sampling stretches, laid out at an approximate sampling distance of 200 m between the stretches. The stretches itself were 200 m. The first sampling stretch was selected downstream to avoid recapture of fish species and the preceding stretches were selected upstream in a purposive manner as sampling the whole area was physically not possible and inaccessible. Cast nets were used to collect the sample for Snow trout and spinner were used to collect Brown trout adopting the catch-and-release method.
Water parameters such as temperature, pH, total dissolved solids (TDS), salinity and conductivity were collected using a Hach Kit Model HQ40d (Hach, Loveland, CO, USA). The sex of the fish samples was identified by gently squeezing the lower belly region of the specimen around the anal opening and observing whether white milt or eggs are released. The number of individuals caught per netting was assessed as one catch, which was repeated depending on the habitat types of the sample site. A total of two fish species belonging to the different species were also collected for the gut content analysis. The individual sampling stretch was divided into three different habitats namely run, pool and cascade. The number of casts was equally divided between the three habitats in a sample stretch, with a total of six throws of cast net for Snow trout and 16 spinner throws for Brown trout. The total length of the fish species was measured in centimeter in the field with the use of a digital caliper and the total weight was measured in grams by using an electronic weighing balance.
Data generated were punched in Microsoft Excel and analyzed using Personal Computer Ordination (PC-ORD, Wild Blueberry Media, Corvallis, OR, USA) and R Studio (R-Studio, Boston, MA, USA). Counts of each species were tabulated to determine the relative abundance of the species. Total length and total weight of the species were used to examine the type of growth attained by the fish and whether fish become healthier with increasing length (Arslan et al., 2004). For the length-weight relationship (LWR) calculation, the values of a and b were calculated from the equation; W = aLb, where the parameter a in the equation represents the coefficient of the arithmetical LWR and its 90% values range between 0.001 and 0.050. The coefficient b in the equation is the exponent of the arithmetical form of the LWR, with 90% of the values ranging from 2.700 to 3.400 (Li et al., 2023).
Cluster analysis was carried out to determine the similarity between plots. A principal component analysis (PCA) was conducted to relate environmental parameters with the presence of each species. Logistic regression was also conducted to detect the coexistence and habitat preference of these species. A recruitment graph was developed to determine the status of the fish recruits and spawners of both species following Rosenberg (2003). The population structure was determined using the length-frequency data for both species and a sporadic or inverse J relationship compared (Wangda & Ohsawa, 2006). The sex and maturity ratios of both species were also computed for information on population dynamics.
Results
The presence of Brown trout was found within 70% of the targeted area of Punatsang chhu basin including Pho chhu, Mo chhu, Toeberong chhu, and the lower reaches of Dang chhu. Brown trout was present above 1,000 masl altitude. While some stretches sampled did not have both the target species, some stretches had Snow trout only and some stretches had both species. The relative abundance of Brown trout in Punatsang chhu was lower (34.5%) compared to the relative abundance of Snow trout (65.4%), excluding other species. Snow trout, however, were found within the whole study area so it is natural to assume that Snow trout is more abundant in Punatsang chhu.
The study recorded a total of 123 Brown trout and 453 Snow trout from the study site which includes the replication. The total length and total weight data of Snow trout and Brown trout recorded to the nearest whole number were computed to determine the correlation between the length and weight of each species. The linear relation was observed when the original values of weights were plotted with the length of the species (Fig. 2).
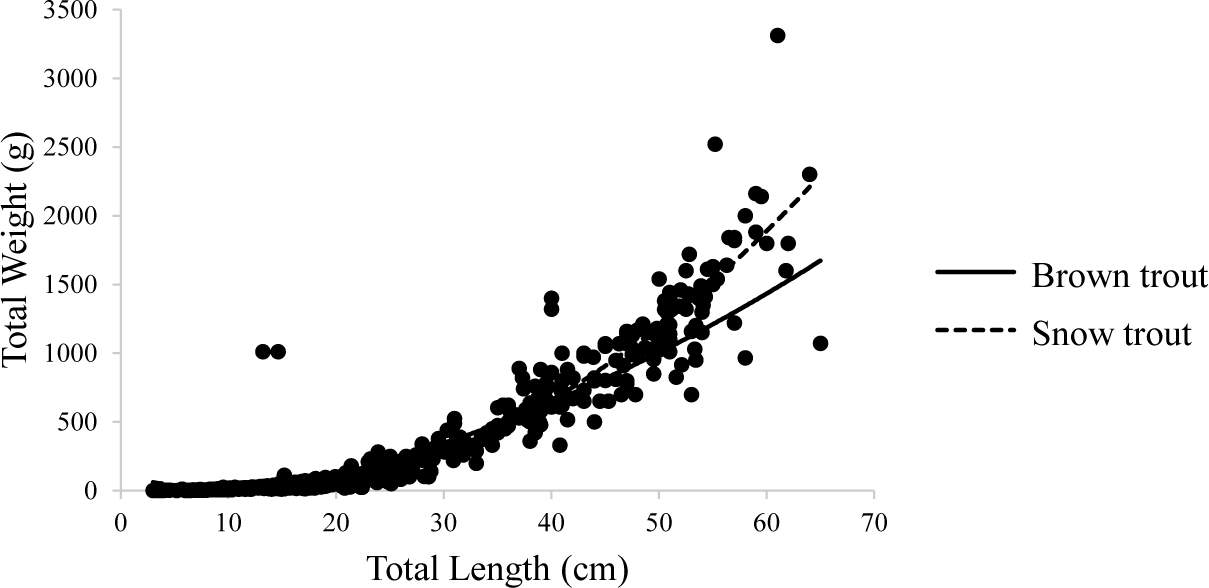
The regression coefficient (r = 0.91) indicated that there is almost a perfect association between the length and weight of Snow trout. Similarly for Brown trout, there was a significant association between length and weight; r = .853, p < .05. The ‘b’ value of the LWR for Snow trout was found to be 2.79 which is less than 3. When the value of b is approximately 3, the fish follows an isometric growth pattern. If the value of b is significantly different from 3, the fish follows an allometric growth pattern. In cases where b > 3, the fish follows a positive allometric growth pattern, resulting in the fish becoming shorter and fatter. Conversely, when b < 3, the fish follows a negative allometric growth pattern, causing the fish to become elongated during the growth process (Li et al., 2023).
The analysis of the sample for Snow trout was obtained as:
The ‘b’ value of Brown trout was 2.36. This value deviated from 3 reflecting a negative allometric growth (2.36 < 3) similar to that of Snow trout which might be because of the time of data collection when the prey species were not abundant. It can be stated from this result that both fish species become longer and slender during the growth process.
The analysis of the sample for Brown trout was obtained as:
Based on the physical parameters of the sample stretch and the count of both fish species combined, cluster analysis was carried out. Similar plots were classified based on the Bray-Curtis similarity index of 75%, similar to a study conducted by Arostegui et al. (2017). The cluster analysis showed three different types of clusters i.e. Snow trout dominated cluster, Snow trout and Brown trout cluster and Brown trout dominated cluster (Fig. 3).
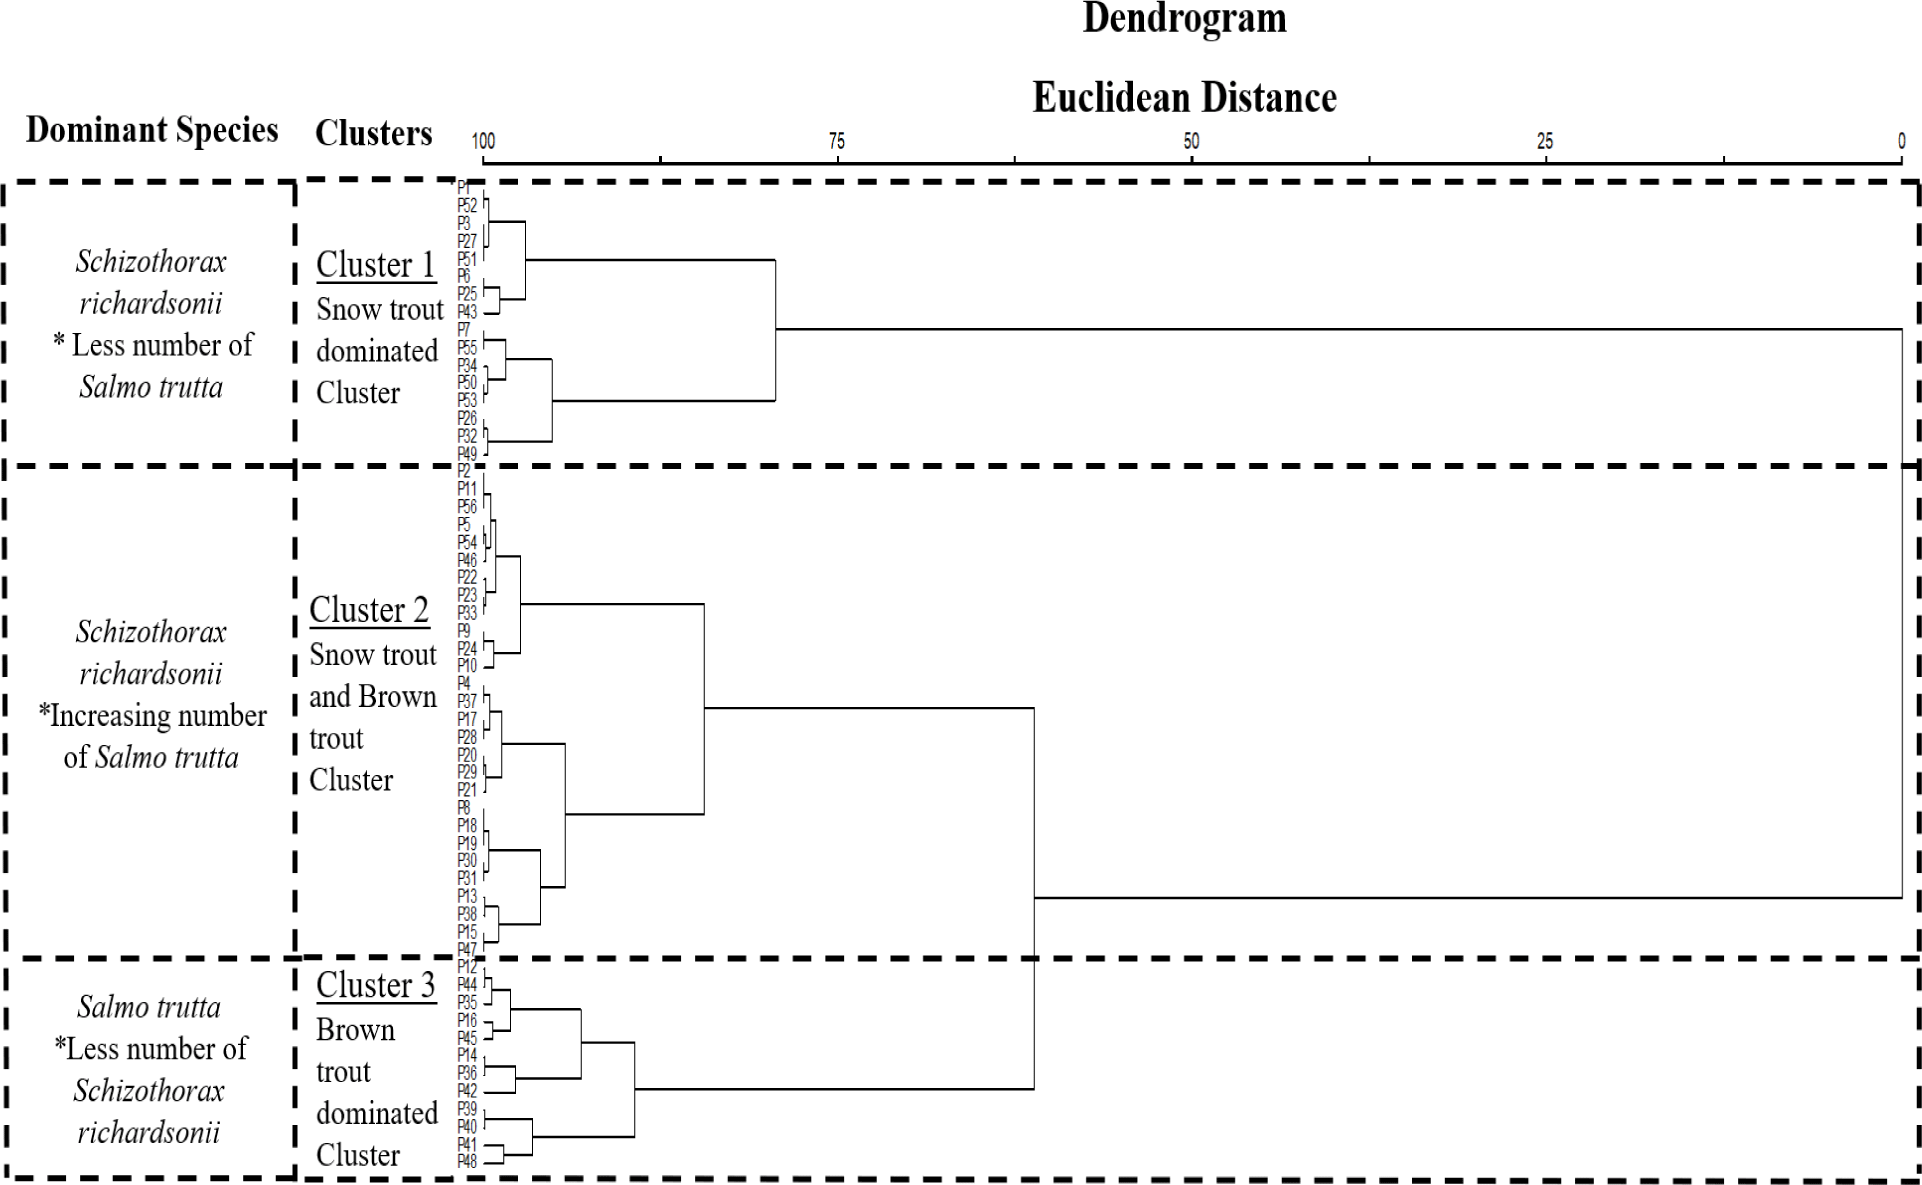
Most of the plots/sample stretches under this cluster were found distributed in lower parts of the basin with no or less presence of Brown trout i.e., x̅ = 0.187 (SD = ±0.135) and higher presence of Snow trout i.e., x̅ = 16.62 (SD = ±0.845). The lowest altitude of the cluster was 913 masl and the highest was 1,432 masl. The mean values of the environmental variables were highest for the Snow trout dominated cluster compared to the other clusters. The mean water temperature for the cluster was 14.3°C which was the highest compared to the rest of the clusters indicating that these plots were in warmer areas.
The plots falling under Snow trout and Brown trout cluster were found distributed in parts of the basin which had less presence of Brown trout i.e., x̅ = 0.67 (SD = ±0.185) and medium presence of Snow trout i.e., x̅ = 5.60 (SD = ±0.582). The lowest altitude of the cluster was 963 masl and the highest was 1,419 masl. The mean water temperature for the cluster was 12.14°C which was moderate compared to the rest of the clusters indicating that these plots lay in areas preferred by both the species. However, the mean count of Snow trout had drastically decreased compared to Snow trout dominated cluster and the mean count of Brown trout increased slightly. Brown trout was not absent in all of the plots indicating an increase in count compared to that of Snow trout dominated cluster. The plots still had more numbers of Snow trout however, the plots having a lower number of Snow trout in this cluster had a higher number of Brown trout and vice versa.
The final cluster in the dendrogram represented the plots with a higher presence of Brown trout having a mean of 8.1 (SD = ±1.0) and a lesser presence of Snow trout with a mean of 4.41 (SD = ±0.49). The lowest altitude of the cluster was 1,196 masl and the highest was 1,320 masl. The mean water temperature for the cluster was 11.3°C which was the lowest compared to the above clusters indicating that these plots lie in colder areas. The water in these plots is favourable for Brown trout. The mean count of Brown trout in this cluster has increased compared to the mean count of Snow trout which is opposite to the plots in Snow trout dominated cluster. The number of Snow trout was much less in these plots and Brown trout was more indicating the decrease in count of Snow trout population in the face of Brown trout presence. The plots having the highest number of Brown trout in this cluster had the lowest number of Snow trout and vice versa.
The PCA was conducted to examine the variability of an assemblage of Brown trout and Snow trout by reducing the original data to a dataset with a smaller number of principal components (Kimball & Able, 2007). The count of both species for all habitats combined was included in the PCA using a component matrix.
Table 1 represents two of the principal components with the factor or component loading and environmental parameters with PC1 and PC2 using 56 samples and six environmental parameters. PC1 has higher eigenvectors for water TDS (64%) and water salinity (60%) which represents a good solution with the loading factor higher than 0.3. PC2 has a high eigenvector for altitude (36%) indicating a strong positive influence on the variance of PC2. Water pH (60%) and water temperature (60%) indicate a strong negative influence on the variance of PC2. The two principal components explained 65.47% of the variables accounting for 36.73% and 28.74% of the total variance for PC1 and PC2 respectively.
Brown trout in Punatsang chhu preferred clear, cold, and deep pools with higher mean temperature i.e., 12.1°C (SD = ±0.6), lower mean TDS i.e., 102.6 (SD = ±4.5) and lower mean salinity i.e., 48.7 (SD = ±0.7). The stretches of rivers having Brown trout have cobble or pebble as the bed substrate. Snow trout usually required clear, cold, and shallow riffle waters with similar mean temperature i.e., 12.3°C (SD = ±0.5), higher mean TDS i.e., 154.6 (SD = ±6.4) and higher mean salinity i.e., 64.1 (SD = ±3.2).
A bi-nominal logistic regression was performed to detect associations of the two species with the water parameters (Table 2). A study conducted by Korsu et al. (2012) also used a similar model for the habitat occurrence of two focal fish species.
The value of proportionate change (Exp[B]) in odds is > 1, as the predictor increases, the odds of outcome increases and when Exp(B) is < 1, as the predictor increases the odds of outcome decreases. In this study, Table 2 concludes that the odds of finding only Snow trout in plots of higher altitude is 1.008 times higher than finding Brown trout. Similarly, the odds of finding Snow trout in plots of higher temperature, and higher water pH are 1.054 and 1.039 times more than the odds of finding Brown trout. However, the odds of finding Snow trout in plots with higher TDS and salinity are 0.948 and 0.907 times less than finding Brown trout.
The number of juveniles and adults of Punatsang chhu was used to map the recruit-spawner relationship to identify the status of the target species following Rosenberg (2003). The spawner-recruit relationship graph (Fig. 4A) of Brown trout represented a linear upward slope which indicates that as the slope of recruits to spawners increases, the fish mortality decreases because more of the recruits would be able to replace the spawners (Rosenberg, 2003).
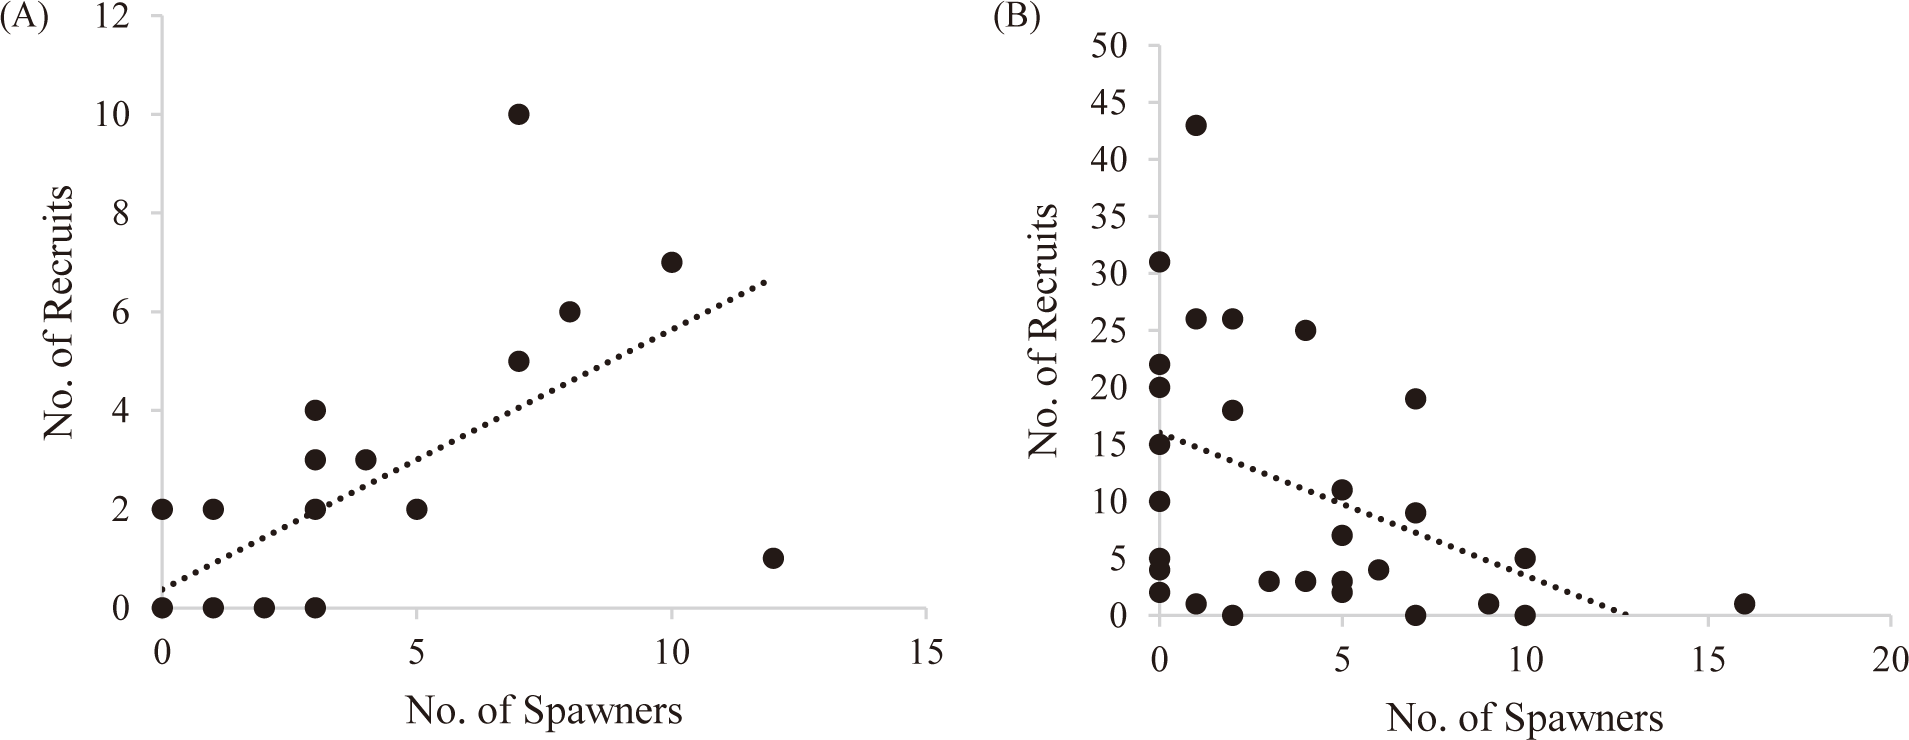
The curve in the spawner-recruit relationship of Snow trout (Fig. 4B) represents a linear downward slope which indicates that as the slope of the line relating recruits to spawners decreases, the fish mortality increases. This means that most of the juveniles of Snow trout do not survive long enough to attain adulthood and reproduce. The decline in the recruitment of Snow trout and the increase in Brown trout indicates a negative effect of the invasive species on the native fish of Punatsang chhu.
The population structure for both species was modelled using the length-frequency graph, following Wangda & Ohsawa (2006) who determined the recruitment of tree stand structure. This study was used to determine fish fingerling recruitment on an exploratory basis. The graphical relationship to understand the population dynamics of the two species is provided in Fig. 5.
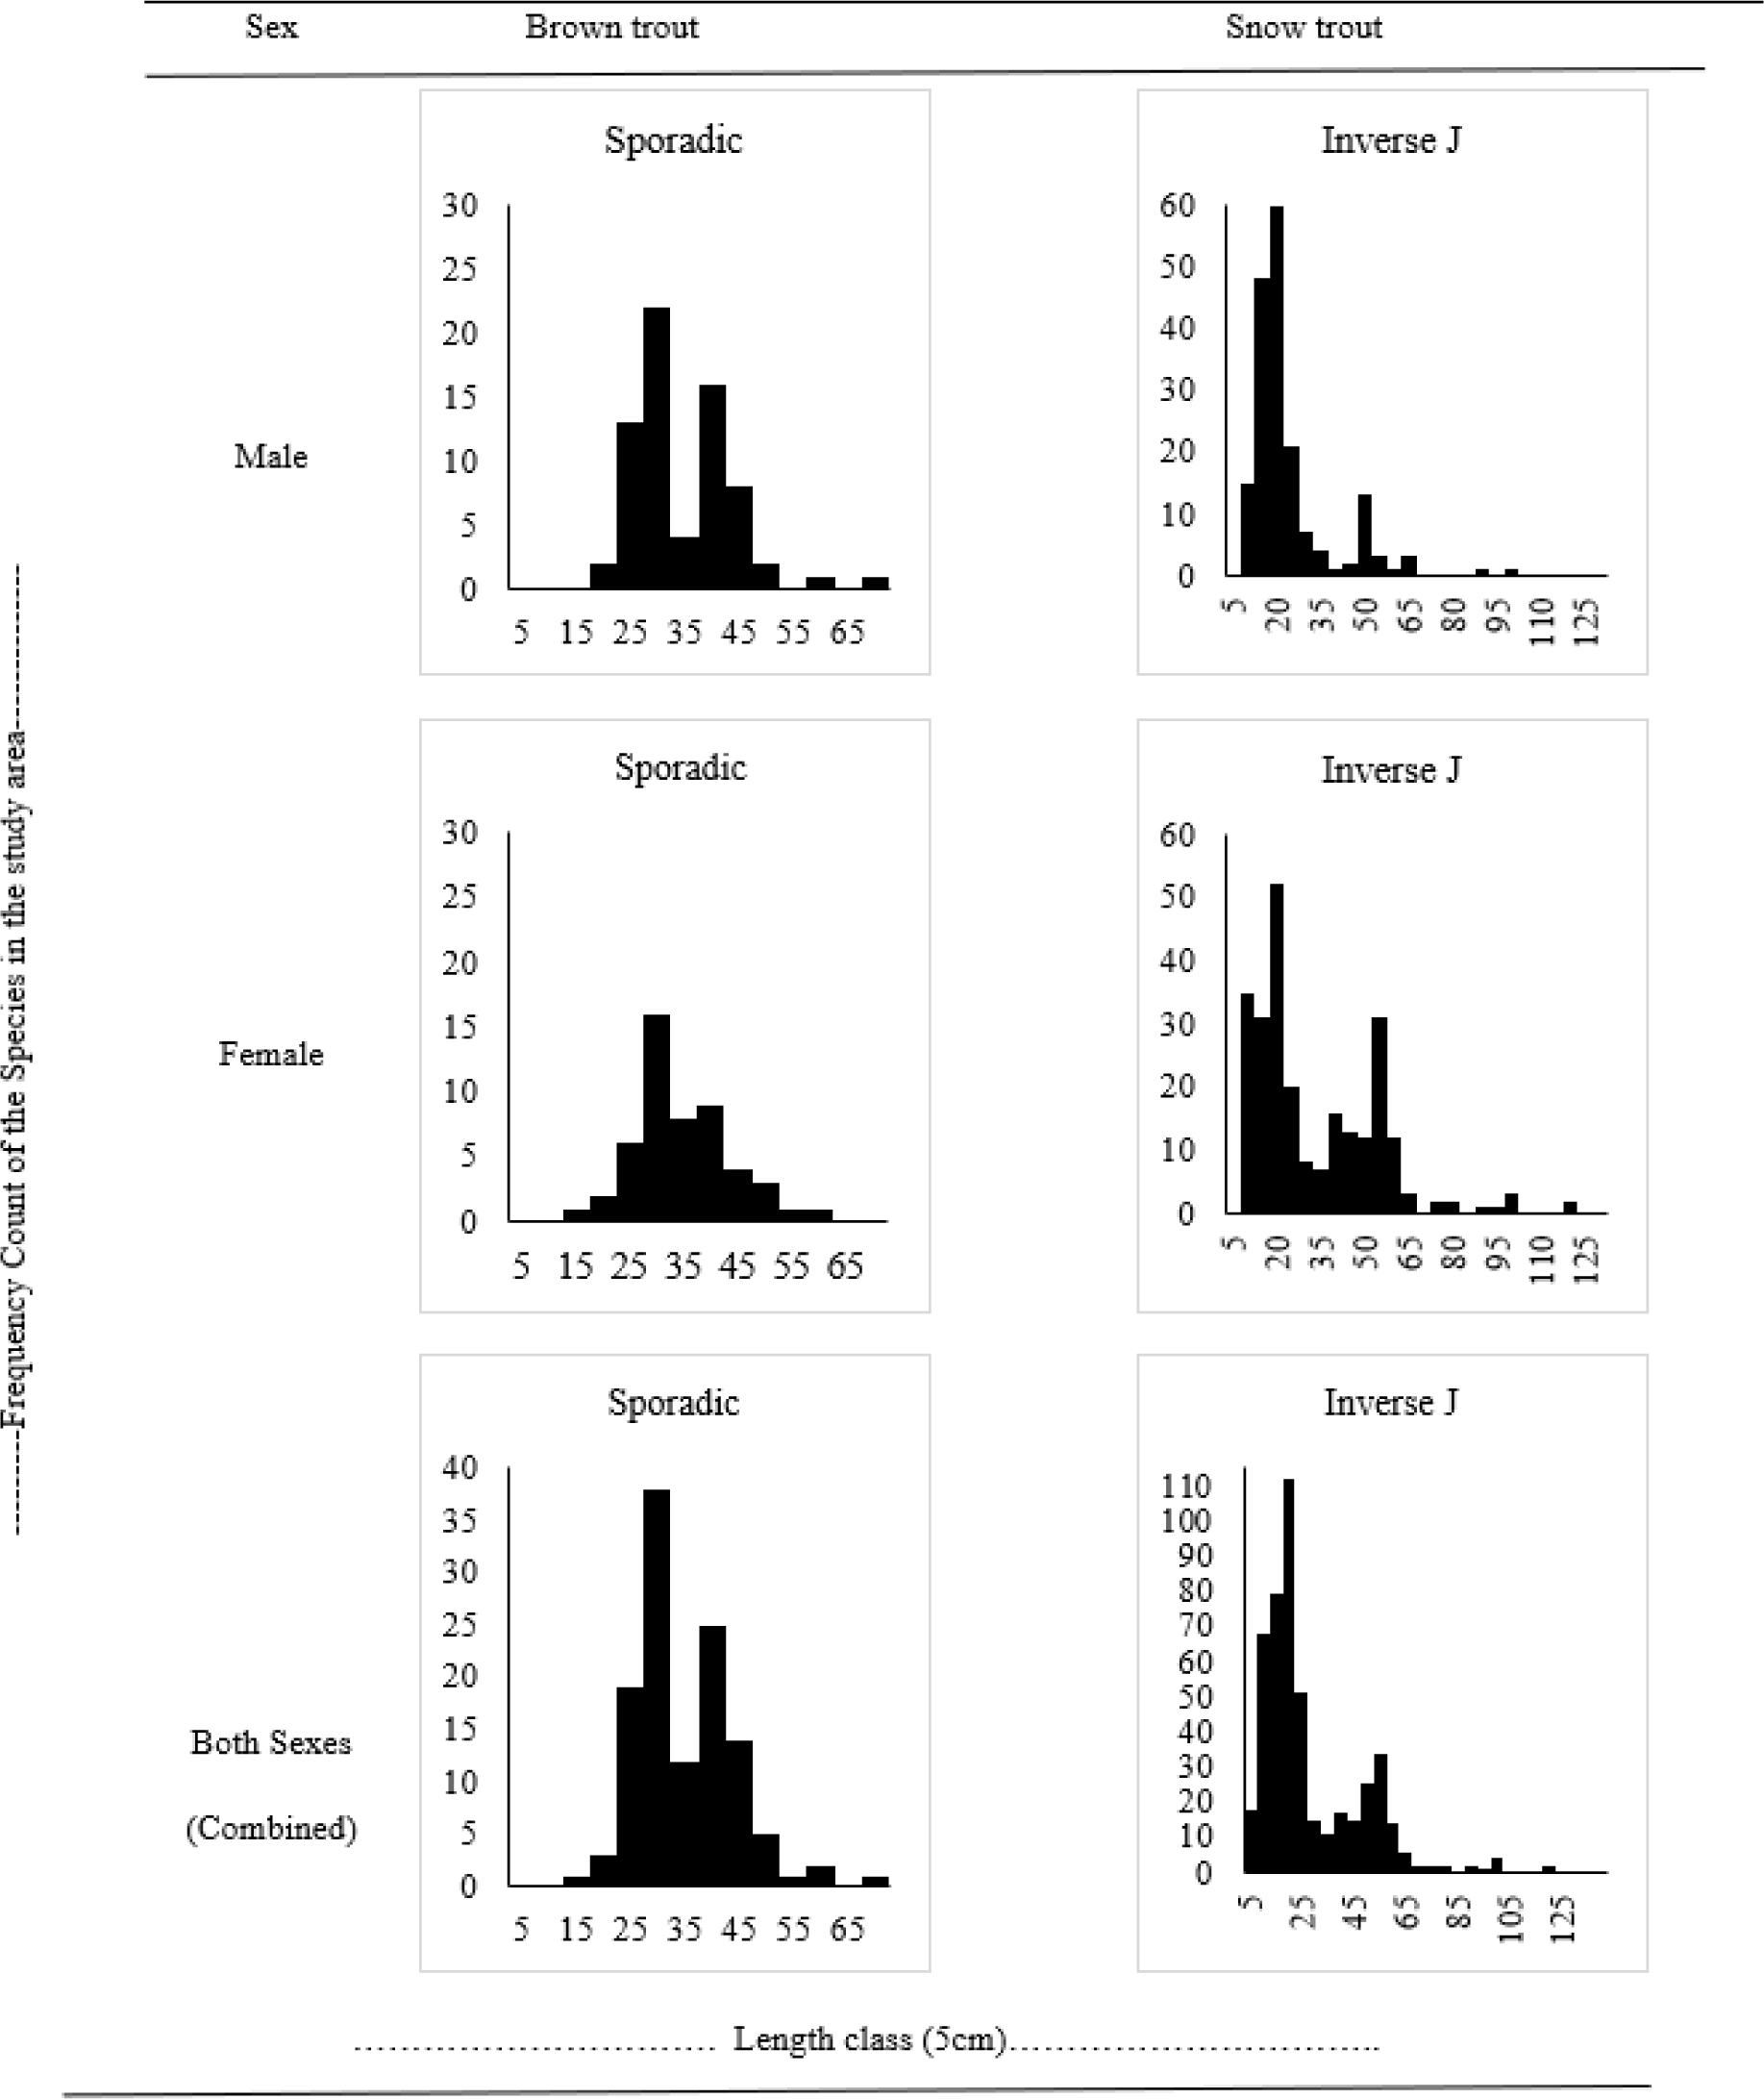
The graph for length and frequency count of both male and female Brown trout appeared to be sporadic. The sporadic distribution of both sexes of Brown trout represents a good pattern with a fair chance of the population survival in future. The combined graph for both sexes also showed a sporadic type of distribution. Length-frequency graph for Snow trout of both sexes appeared to be exhibiting an inverse J relationship. This inverse J distribution for male and female Snow trout represents an excellent pattern with a very good chance for their population to survive in the future. The combined graph for both sexes also represented an inverse J relationship indicating an overall trend and healthy population.
The gut content analysis conducted on the adult Brown trout also resulted in the presence of fingerlings of various fish species in the intestine. The primary species was the Snow trout, the juvenile of which had been frequently consumed by the invasive species. The gut of Snow trout on the other hand consisted of algal deposits, a hint of sand and the skeleton of macroinvertebrates. The fingerling consumed by Brown trout was 7 cm in length and 9 g in weight which indicated that a relatively normal-sized juvenile was a regular of the species.
The ratio for males and females for total numbers differed significantly (p < 0.05). The ratio for Brown trout was 3:2 and for Snow trout was 2:3. The ratio of Brown trout represented that the number of males was more compared to females in the study area whereas, for Snow trout the number of females was more than males. In the case of Snow trout, the greater number of females and fewer males suggests a greater number of spawners.
The ratio of juvenile to adult for the total number of individual fishes differed significantly (p < 0.05). The ratio for Brown trout was 4:3 and for Snow trout was 4:1. The ratio of Brown trout represented that the number of juvenile fish was one time more compared to adults. In the case of Snow trout, the juveniles were four times more compared to the adults. The lesser difference between the number of juveniles to adults for Brown trout suggests a good population.
Discussion
The variability in the presence of Brown trout in certain stretches is because the species’ survivability in lower altitudes and temperatures is low (Vincent & Miller, 1969). Due to the habitat preference of the species, there is a clear distinction in the range within which the species survives and coexists with different species (Greer et al., 2015). Similarly, Snow trout being a native species in the study, are well adapted to the river and have high abundance. Lohani & Ram (2018) conducted a study in the rivers of Uttarakhand in the Western Himalayas where the species S. richardsonii was native and widely abundant.
An imperfect association between the length and weight relationship for Brown trout was similarly reported by Treasurer (1976) from a coastal dune lake in England. Treasurer (1976) cited the slow growth of the species as the reason for the imperfection which can also be associated with the Brown trout in Punatsang chhu. Negative allometric growth of male Brown trout during the winter season was also concluded by Jan et al. (2018). A negative allometric growth pattern occurs when the length of a fish increases more slowly than its weight, whereas positive allometric growth is characterized by the weight of the fish increasing at a faster rate than its length (Terashima, 1984). The Brown trout species in the study site have an abundance of food for consumption as they consume the juveniles of native species contributing to an increase in weight.
Out of the three different clusters obtained (Fig. 3), the first cluster had an increased presence of Snow trout compared to Brown trout as it is evident that the invasive species usually prefer areas of lower water temperature and are rarely found in warmer areas except when washed downstream (Spigarelli et al., 1983). The habitat selection of both species within the study site is limited by the physical characteristics and environmental conditions (Ayllón et al., 2010). The lowest temperature at which the Brown trout was found in the study site was 15.7°C which was by far the warmest temperature the species was caught from in the country.
The second cluster was the cluster where both species existed even though the number of Snow trout was relatively higher in a majority of the plots. However, the plots having a lower number of Snow trout in this cluster had a higher number of Brown trout and vice versa. This indicates the presence of competition between the two species or the Brown trout can displace Snow trout to a certain extent in these plots (Wissinger et al., 2006). Various literature have highlighted the invasive nature of Brown trout and in the study site, the decreased numbers of the Snow trout in the presence of these species represent that there is a habitat overlap between the two species. In India, Thapliyal et al. (2016) also reported similar results of overlap and the invasive species dominating.
The third cluster was dominated by Brown trout which attains the higher rate of invasion by the species. The lower presence Snow trout was similar to the case in the study conducted by Sharma et al. (2021a) in Nepal. The final phase of an invasion is the removal of the original population and being replaced by the invaders and this cluster represents a change in the dominant population. Brown trout exhibit a competitive dominance and maximum utilization of space (Sharma et al., 2021b) similar to the findings of this study.
The variability in the habitat of the two species greatly influences their distribution in the study area. The lower loadings for the pH and temperature between the two principal components are the result of similar preferences. Both species prefer habitats of similar temperature and pH (Sharma et al., 2021b) although the Snow trout has a wider range in which it can survive. The parameters were similarly discounted in the study conducted by Sharma et al. (2021b) including certain habitat types which have not been included in this study.
The results of habitat distribution from this study correspond with the study conducted by Rawat et al. (2011) where the Brown trout were found in similar bed substrate types. Brown trout living in rivers require cold water and increased dissolved oxygen in the river to survive with the temperature range from 12°C–19°C (Rawat et al., 2011). The mean water temperature of this study site favoured the distribution of the species. According to Rajput et al. (2013), Snow trout are found in areas where the bed substrate has good algal deposition. The species are bottom feeders and scrap algae from bedrocks for consumption. Snow tout occurrence between similar temperatures to Brown trout is evident but the species has an advantage when it comes to higher temperatures (Rajput et al., 2013). The difference in occurrence of both species due to the bed substrate provides a distinction of their niche. The invasion comes into effect when the fingerlings of the native species are consumed by the Brown trout.
The odds of the two species existing in the same stretch of the study site depend on the habitat characteristics which allow the species to grow and attain maturity. One of the species can also displaced if there is fierce competition from the other species (Lohani & Ram, 2018). Results from the data state that there is a high probability of finding Brown trout in stretches of increased water TDS and Salinity. A study conducted by Ayllón et al. (2010) found similar variabilities in the habitat selection of the species which is because the species are surface feeders and require less turbid habitats to forage. The probability of finding Snow trout species in higher temperatures, pH and altitude is similar to the other species but the native species also prevail in lower temperatures.
The recruitment of Brown trout showed decreased chances of mortality as there was a higher number of juveniles to replace the spawners, which signifies that for a balanced future population of the species, spawners need to be harvested. Rosenberg (2003) utilized this recruitment concept for assessing the population of Brown trout in a lake which provided similar results. An experimental study conducted by Kaspersson et al. (2013) in various rivers in Sweden showed an increased density of juvenile Brown trout and a similar recruitment graph. Although the streams did not have the Snow trout as the native species, the established native species were displaced.
The Snow tout recruitment represented increased mortality as the number of juveniles was less and was not enough to replace the spawners, which signifies that the number of juveniles needs to be increased for a balanced future population. As proven by Kaspersson et al. (2013), there is a decrease in growth rate and an increase in mortality of native fish species in the presence of Brown trout. This is because the species is a carnivore and feeds on smaller fish species to survive, which also includes juveniles of Snow trout (Saavedra-Díaz et al., 2016). Joshi et al. (2016) also found similar results of declining recruitment of juvenile Snow trout. The Snow trout species has been native to the study area for decades and a reduced population of the juvenile species can likely be attributed to the unsuccessful recruitment caused by the predation and competition from Brown trout (Sharma et al., 2021b).
The different types of length-frequency distribution include the inverse-J which indicates that there are more juveniles of the species compared to mature ones; sporadic which indicates a population on there way to dominance with equal numbers of matureand juveniles and; uni-model which indicates that only mature species exist without any juveniles (Wangda & Ohsawa, 2006). The sporadic distribution for Brown trout and inverse-J distribution for Snow trout in the graph (Fig. 5) could be attributed to the competition between the species being at a nascent stage. However, Korsu et al. (2012) have found out that Brown trout invading areas occupied by Snow trout fingerlings is imminent and this threat cannot be discounted. The Brown trout population cannot be controlled with the presence of Snow trout and it would be a matter of time when the distribution is reversed between species. The fingerlings of Snow trout are mostly preyed by Brown trout during monsoon season when the fingerlings are washed down from the tributaries to the main river (Thapliyal et al., 2016) and because this study was conducted during the pre-monsoon season, the results could vary. Monsoon season in the study site varies widely and the erratic rainfall pattern prevented both pre and post-monsoon data collection.
There was a lesser number of female Brown trout compared to males which suggests a varied reproduction rate compared to Snow trout. However, Goodwin et al. (2016) concluded in their study that even a small number of female Brown trout can drive reproduction in a stream which seems to be comparatively similar to this study. The exposure of male Brown trout to the fishing gear and ecology of the fishes (surface feeders) could be the reason for the deviation in the ratio. The Snow trout had more females but there were few juveniles which suggests that the spawners dominate the study site. The spawning season of Snow trout and the sampling concluded during this study which might be a reason for more females being caught and the probable difference in sex ratio.
The ratio for Brown trout represented a lesser difference between the juveniles and adults whereas Snow trout represented a higher difference. As per Reynolds & Babb (1978), the ratio of juvenile-adult indicates important aspects of the fish population dynamics as a lower difference means that the adults can be quickly replaced by the juveniles and the population could thrive. However, the difference between juveniles to adults for Snow trout does not indicate a good population. According to a study conducted by Pope et al. (2010), a large ratio indicates exploitation and a balanced ratio is required for consistent successful recruitment of any species.
Conclusion
The distribution pattern of the two species (Snow trout and Brown trout) in Punatsang chhu indicated that both species are influenced by various water parameters. Both species exhibited negative allometric growth. Brown trout preferred areas of lower temperature and higher altitude and avoided areas of higher turbidity and salinity compared to Snow trout. Brown trout are present only in areas above 1,000 masl and Snow trout are distributed in both the upper and lower reaches of Punatsang chhu. Snow trout occupy shallow and fast-flowing river sections with higher deposition of algae and Brown trout occupy deeper pools where all the smaller insects and fingerlings are displaced. The study area had plenty of stretches not occupied by Brown trout but in areas where both species existed, the number of Snow trout was least represented.
In the main river, an effect in the recruitment of Snow trout was noticed which is due to the presence of Brown trout affecting the younger population. The recruitment process is affected by a decrease in fingerlings of Snow trout. The length-frequency graphs of both species indicated a good population status. The lesser ratio of juvenile to adult Snow trout indicated an unstable population which is imbalanced by the carnivorous nature of Brown trout. The results of gut content analysis also indicated that Brown trout species consume the fingerlings of Snow trout and also provides evidence on encroacment of habitat.