
Introduction
Pelagic fish, especially mackerels, are popular among fishermen and have high economic potential. In Asian countries like Korea, Malaysia, and Japan, mackerels are commodities that gained increasing popularity in the last decade for consumption, mostly due to their affordable prices (Abubakar et al., 2019; Wang et al., 2023). Similar trends can also observed in Indonesian mackerel species such as the Indian mackerels (Rastrelliger kanagurta). The Indian mackerel (R. kanagurta) is a small pelagic with great potential in almost all Indonesian waters. Indian Mackerels have important economic value and are easy to catch in large quantities because of their schooling nature. Most local fishermen generally catch this species using seven variations of traditional gears and methods such as hand line fishing, gill nets, lampara nets, beach seines, drift gill nets, raft nets, and purse seines (Bintoro et al., 2019).
Barru waters has also been one of the potential areas for fisheries. The sea fishing area covers around 56,160 Ha. Indian mackerel (R. kanagurta) is the most caught commodity by Barru fishermen. Statistical data on Indian mackerel total production in Barru waters showed a significantly higher production than in the surrounding waters. Currently, protein consumption trends in Barru tend to prefer fish over chicken and meat as protein sources, although the prices still experience fluctuations. In addition to its affordable prices, fish as protein sources are believed to be more nutritious (Rahim et al., 2022). Mackerels are among the top three major national commodities contributing to national gross domestic product (GDP), along with skipjack tuna and anchovies (SEAFDEC, 2014).
However, in the last two years, Indian mackerel catch from Barru waters has fluctuated sharply. In 2018, the mackerel catch decreased to 1,696.0 tons; in 2019, the total catch increased to 1,785.10 tons. Similar fluctuations also re-occurred in 2020, where catch production decreased by 1,559.20 tons and increased again in 2021 to 1,757.6 tons (DKP, 2020). Central Bureau of Statistics data also indicated the decreasing trend of Indian mackerels’ weekly consumption per capita. The average weekly consumption of Indian mackerels per capita from 2009 to 2011 showed the highest consumption rates, while in the remaining years, from 2012 to 2018, the consumption rate decreased to a level below the previous years (Central Bureau of Statistics, 2018). These findings become a dilemma considering that most families in Barru relied heavily on sectors of agriculture and fisheries industries. At the same time, this implies that any minor changes that occur in the Barru fisheries industries will have a massive impact on regional economic development.
Vast Indonesian water territories covering nearly four times larger than its land area may provide massive supplies of marine resources. However, no clear and updated instrument has been used to control mackerel fishing practices in Barru waters. In contrast, careless and continuous exploitation of Indian mackerel resources without proper adaptation of fishing gear and selective technologies could soon lead to the depletion of natural fish stock. As mentioned above, fluctuation in annual mackerel catch is also a high potential indication of overfishing. Besides, the schooling nature of the Indian mackerel could further promote the increasing exploitation rate of this species (Burgess et al., 2013). Overfishing has been a challenging and emerging issue on a national scale in Indonesia, including Barru waters, primarily due to unsustainable fishing practices and a lack of proper standardization in fishing management policies (Jaya et al., 2022). Standardizing fisheries practices is essential in tropical areas like Barru to ensure uniform and accurate catchability from fishing gear variations.
Very few studies have explored the current biological condition and population dynamics of Indian mackerels, specifically in Barru waters. A study by Bintoro et al. (2019) analyzed the biological aspects of captured Indian mackerels from Madura Strait. The measured biological aspect included sex ratio, gonadal maturation stages (GMSs), gonadosomatic index, length-weight relationship, length at first capture, and some growth parameters. The measurement of all these parameters strongly indicated immature fish as the dominant capture in the local fishermen’s catch. Another recent study performed by Saputra & Taufani (2021) attempted to study the population dynamics of Indian mackerels from North Java, which revealed the mortality, fishing mortality, natural mortality, and exploitation rates. The study suggested the clear presence of overfishing.
The majority of the studies on Indian mackerels tend to analyze Indian mackerels’ population dynamics and biological aspects separately. While it is understood that studying biological aspects could provide vital and recently updated data on immature fish capture and reproduction trends, integrating the analysis of biological aspects and population dynamics will be capable of detecting the presence and the causes of overfishing and provide valuable information on the standards of exploitation limit, appropriate and accurate fishing gear design for a certain species, and guidelines for both local fishermen communities and the decision-makers. In addition, data and records concerning biological aspects and population dynamics will require regular evaluation and updates because any of these values may change over time and vary from one location to another (Venturelli et al., 2017).
Therefore, due to poor available data on the current biological aspects and population dynamics of Indian mackerels in Barru waters, a comprehensive study that integrates both analyses on Indian mackerels as an effort to support sustainable and optimal Indian mackerel exploitation without damaging the future natural fish stocks and its capacity to repopulate is considered necessary.
Materials and Methods
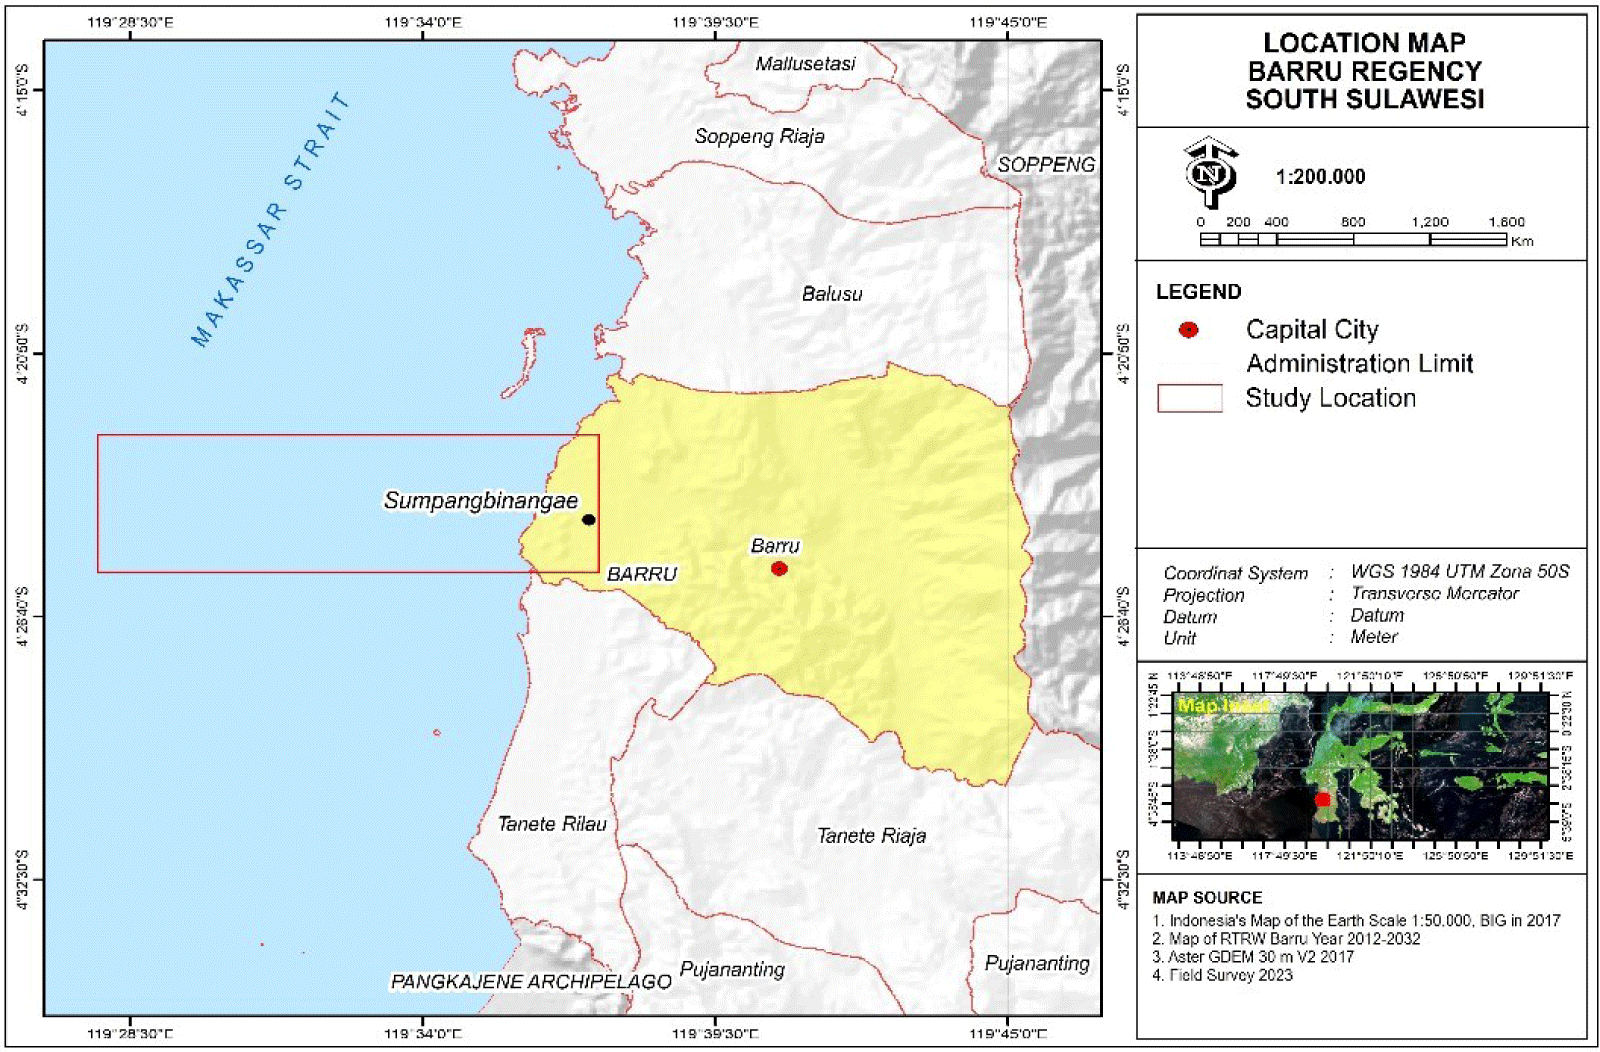
The research was conducted for 11 months, from June 2022 to April 2023, in Barru waters. As many as 1,257 Indian mackerel samples were collected from local fishermen’s catch captured using gill nets and traditional lift nets (Bagan) in dry and rainy seasons. The samples employed in this study were only from Barru waters, Makassar Strait, Indonesia. The following map presented in Fig. 1 provides detailed coordinates and location of the research site.
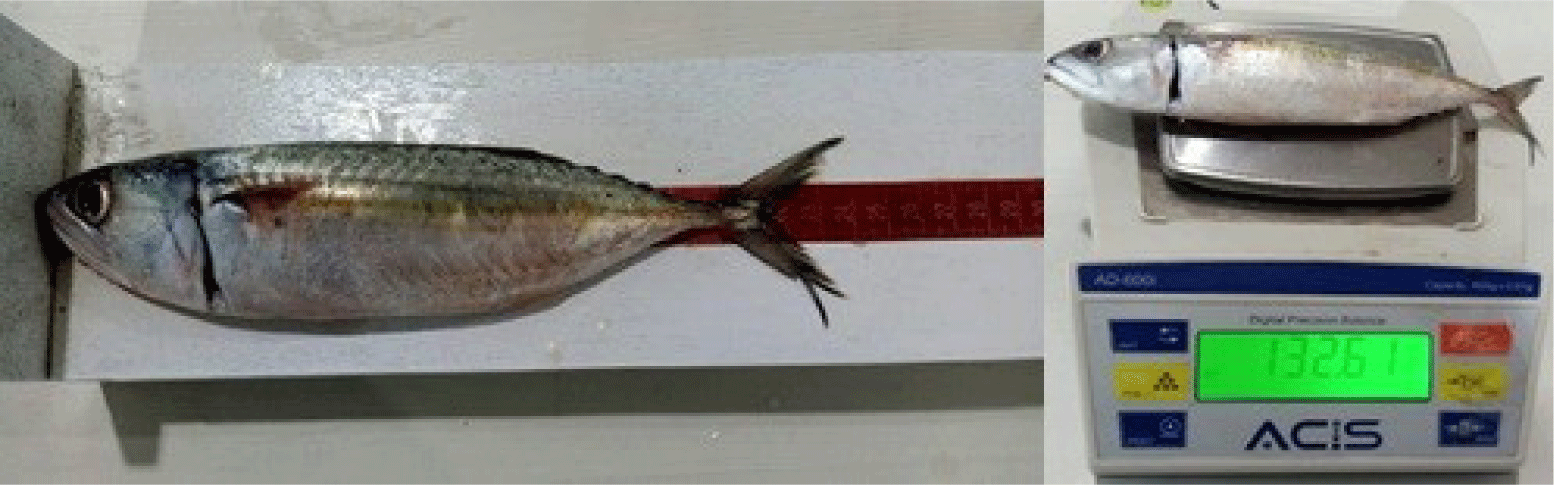
Sampling of Indian mackerels was performed once a week at the Sumpang Binangae Fish Landing, Barru. Primary data were generated from the fork length measurements, fish weight, and GMS. Fish samples were measured in fork length (the length from the tip of the fish snout to the fork of the tail) using a measuring board at an accuracy of 0.1 cm, while the fish weight was obtained by weighing the samples using a digital scale at an accuracy of 0.1 gram (Fig. 2).
Fish GMSs were observed morphologically using indicators similar to those of Ganga (2010) (Table 1). From the overall samples of 1,257,473 Indian mackerels (219 males and 254 females) were used in the gonadal maturation level observation. The classification of gonadal maturation in female and male fish can be seen as follows:
Fish length at first gonadal maturation (Lm) was calculated using the Spearman–Kärber method (Udupa, 1986) with a 95% confidence interval using the following formula:
where:
Xk = last log size at which 100% of fish gonads are fully mature
X = log size increment
Xi = log of the median
pi = ri / ni; ri = number of fish with mature gonads in group I
ni = number of fish in class I
qi = 1 – pi.
Where variance:
The length-weight relationship of Indian mackerel (R. kanagurta) was measured using the growth formula by Bal & Rao (1984) as presented below:
where:
W = fish weight (grams)
L = fish length (cm)
a = constant or intercept
b = exponent.
If b > 3, the growth rate exhibits positive allometrics or a tendency for fish to be stouter or deeper-bodied as it increases in length. On the other hand, if b < 3, the growth exhibits negative allometric or a tendency to be slender. The results of length-weight measurement were processed using Microsoft Excel.
FAO-ICLARM Stock Assessment Tool (FiSAT II Version 1.2.2, FAO, Rome, Italy) was employed to produce the data related to population dynamics, including age group, growth, mortality, exploitation rate, yield per recruitment, long-weight relationship, size at first capture, and size at first maturity. Methods for analyzing the population dynamics can be seen as follows:
In estimating the age group of Indian mackerel (R. kanagurta), the method by Bhattacharya (1967) is applied to calculate the length means and standard deviation of the components assumed to be normally distributed. The formula of this method is presented as follows:
Once the formed age groups are identified, the fish class length will be divided based on the number of cohorts formed. Length means is determined by dividing the sum of the products of the length frequencies and middle-class point (∑ [fx MCP]) by the number of frequencies (∑f) in each cohort.
Indian mackerel growth rate was measured using FiSAT (FAO Iclarm Stock Assessment Tools) II V. 1.2.2 software. The research data is presented in fork length frequency. Before calculating the growth rate, asymptotic length (L∞) needs to be identified. Asymptotic length might be achieved by Indian mackerel without natural mortality (M), and the growth rate coefficient (K) might be achieved by importing fish fork length frequency analysis data during the study.
The collected data were processed using the ELEFAN I method through FiSAT, and it was found that K = 0.46 per year, (L∞) = 29.5 cm, and t0 = –0.3576/year.
The generated growth coefficient values were processed using the Von Bertalanffy growth formula method through the FiSAT II method (Sparre, 1987), and the growth rate will be identified by inserting those values. Estimation of growth parameters for Indian mackerel (R. kanagurta) can be calculated using a fish length-related growth model following the Von Bertanffly growth equation presented as follows:
where:
Lt = Fish length at the age of t (cm)
L∞ = Asymptotic length (cm)
K = Growth rate coefficient (per year)
t0 = Theoretical age of zero length in fish (years)
t = Fish age.
After that, the theoretical age of zero length in fish (t0) was determined using the following formula (Pauly, 1980):
where:
L∞ = Asymptotic length (cm)
t0 = Theoretical age at zero length (years)
K = Growth rate coefficient (year).
Size at first capture is the size in which 50% of the captured fish are vulnerable to the capture gear (Lc50), which was used to analyze the capture curve using the method by Pauly (1984) processed through FiSAT II.
Estimation of mortality consists of three parts, namely natural mortality (M), total mortality (Z), and fishing mortality (F). Each type of mortality can be seen as follows:
Estimation of natural mortalitycan be done using the empirical formula by Pauly (1980) as follows:
where:
M = Natural mortality rate (per year)
L∞ = Asymptotic length (cm)
K = Growth coefficient (per year)
T = Water temperature (°C).
Estimation of total mortality can be performed using FiSAT II on the catch curve by involving asymptotic length (L∞), the growth rate coefficient (K), and the theoretical age at zero length (t0). The formula for calculating the total mortality was developed by Beverton & Holt (1959). The formula can be seen as follows:
where:
Z = total mortality
K = von Bertalanffy growth curve index
L∞ = asymptotic length
Î = Fish length mean in a certain age group
I’ = length of the smallest fish within the sample.
After obtaining the results of estimating natural mortality (M) and total mortality (Z), the estimation of fishing mortality can be performed using the following formula:
where:
F = Fishing mortality rate (per year)
Z = Total mortality rate (per year)
M = Natural mortality rate (per year)
The exploitation rate (E) can be measured by comparing the fishing mortality rate (F) with the total mortality rate (Z) using the following formula by Beverton & Holt (2012):
where:
E = Exploitation rate (per year)
F = Fishing mortality rate (per year)
Z = total mortality rate (per year).
Estimation of yield per recruitment for Indian mackerel can be performed using the following formula by Beverton & Holt (2012):
where:
U = 1 – L’/L∞
M = (1 – E) / (M/K)
E = Exploitation rate (per year)
M = Natural mortality (per year)
K = Growth rate coefficient (per year)
L’ = Lowest length of captured fish (cm)
L∞ = Asymptotic length (cm).
To reconstruct the population from size-wise total catch data in the length-frequency samples raised to the total catch, the length-frequency data were also used to perform virtual population analysis (VPA) for the species using a routine modified from Jones & van Zalinge (1981) and incorporated in the FiSAT package (Gayanilo et al., 2005). The constants of the length-weight relationship (a and b) were used as inputs in the VPA analysis for the species, together with the employed input parameters of L∞, K, M, and F. (Table 2)
The VPA analysis’s outcomes were biomass (tons), yield (tons), total and fishing mortality, and exploitation ratios.
Results and Discussion
The results on biological aspect identification include:
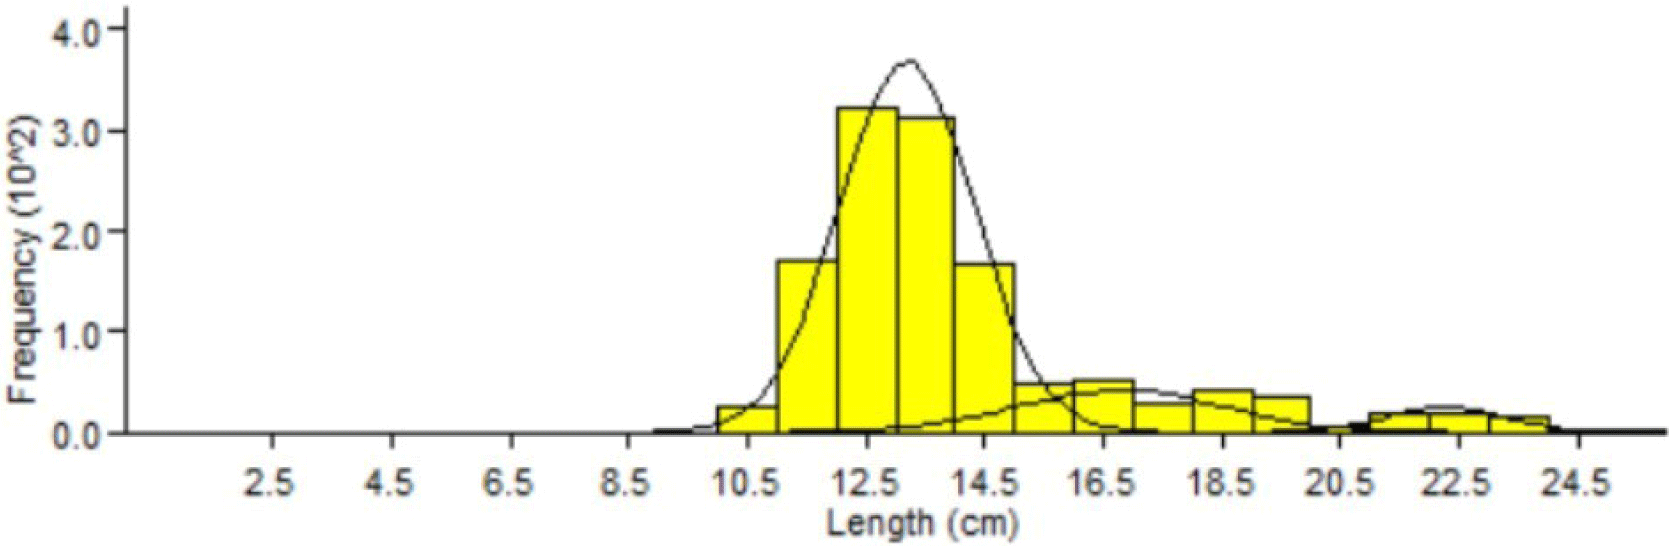
The GMS is a certain stage of gonadal development before and after spawning. The results suggested that the GMS in male and female Indian mackerel was GMS I dominant at class intervals of 12–13 cm, followed by GMS II (18–19 cm), GMS III (22–23 cm), GMS IV (23–24 cm). The GMSin Indian mackerel (R. kanagurta) females can be seen in Fig. 3 below.
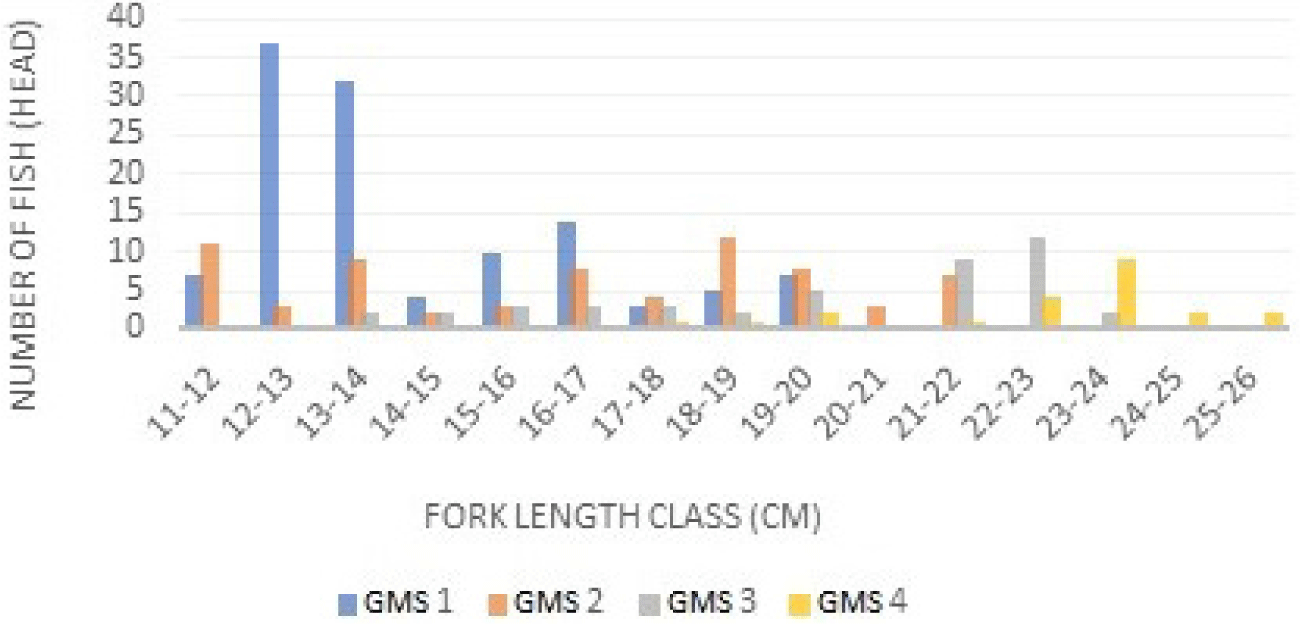
Based on the class interval and relative frequency (Fig. 3), the longer the fish size, the higher the GMS. GMS in male and female mackerel were almost similar, but the intervals were slightly different. GMS I is dominant in class intervals of 13–14 cm, while GMS II is dominant in 15–17 cm class intervals. GMS III is dominant at class intervals of 19–20 cm. GMS IV is dominant at class intervals of 23–24 cm. GMS in male and female mackerel were dominated by GMS I. GMSs of Indian mackerel (R. kanagurta) can be seen in Fig. 4.
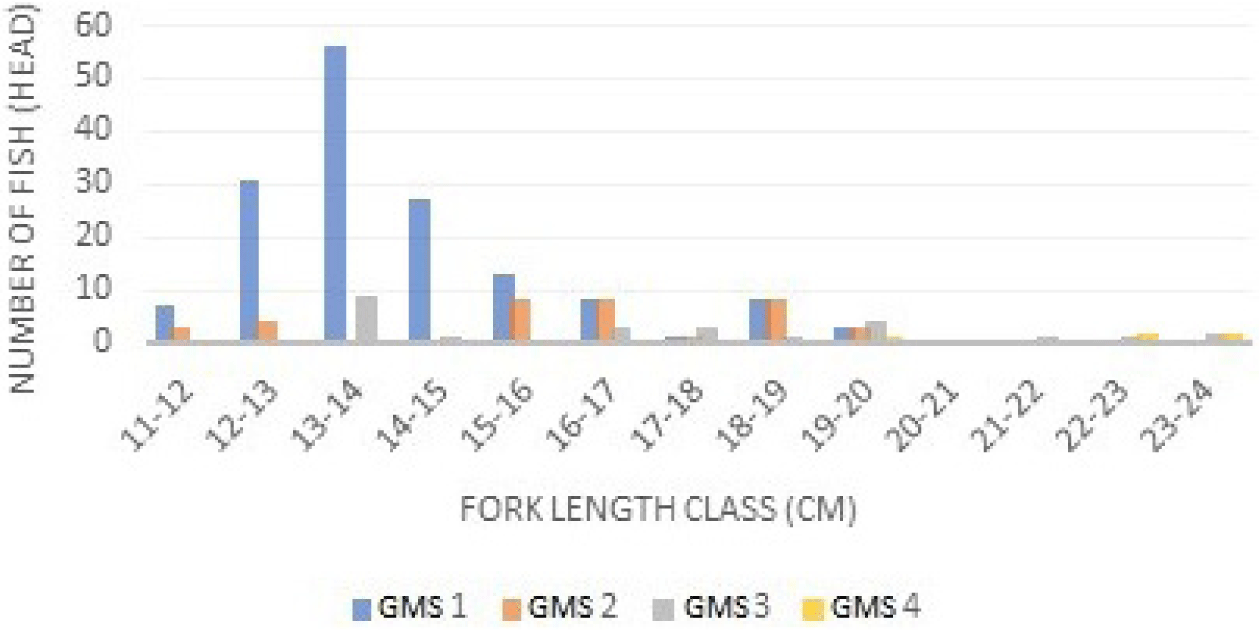
The results of GMS identification of Indian mackerels captured from Barru waters suggested that most Indian mackerels were captured during the immature stage. This can be recognized from the dominance of GMS 1 and 2 (Figs. 3 and 4). Mature fish belong to GMS 3, 4, and 5, and generally, GMS in Indonesian waters is dominated by stages 1 and 2. A study performed by Suwarso et al. (2015) suggested that captured male Indian mackerels in North Java waters indicated the dominance of GMS I (immature), GMS II (maturing I), and GMS III (maturing II), contributing approximately 86% of the catch. Similarly, in North Gorontalo and Madura waters, the GMS of male mackerel is dominated by stage 1. Generally, the GMS of female Indian mackerels is higher than male Indian mackerels. The first sexual maturity of female and male mackerel’ gonads is relatively similar, and fecundity tends to be high. The development of increasingly mature gonads is part of the fish reproduction cycle before spawning occurs. During spawning, most fish metabolism is directed to gonadal development (Piazza et al., 2023).
Studies on the first size of gonadal maturity can be used to indicate existing pressure on the population. Male and female Indian mackerel have a length range of 11–24 cm. The size at first maturity for male and female Indian mackerel can be seen in Table 3 below.
| Size at first maturity (cm) | Male | Female |
|---|---|---|
| Minimum | 17.98 | 17.98 |
| Maximum | 19.28 | 19.27 |
Results on the size measurement at first maturity (Lm) for male Indian mackerel were 17.98–19.28 cm FL; in female Indian mackerel, the size was 17.98–19.27 cm FL. The results of the present study were lower than those of Oktaviani et al. (2014), who found that the estimated size at first maturity for male Indian mackerel was 19.55 cm and 20.71 cm for females. Although Carpenter & Niem (2001) reported that the first mature size of Indian mackerels, in general, is 20 cm, previous studies confirmed the possibility of variation in size at the first gonadal maturity of Indian mackerels from different waters.
For example, Indian mackerels observed in Omani waters were larger at first maturity, with males at 25.7 cm and females at 25.2 cm (Doustdar et al., 2022). On the contrary, the observed Indian mackerels in Indonesian waters had smaller size at first maturity, as reported in the study by Hasibuan et al. (2022) in Sumatera (male: 21.7 cm and female: 22.2 cm) and Kantun et al. (2018) in Makassar (male: 21.2 cm and female: 21 cm). The size at first gonadal maturity found in the present study is quite similar to the findings in a study by Abubakar et al. (2019) in which the female Indian mackerel size at first gonadal maturity is around 17.986–19.284 cm, while male Indian mackerel is around 17.986–19.273 cm and 25.07 cm in fork length.
Results of the Indian mackerel size comparison suggested a smaller size of captured Indian mackerels than the Indian mackerel’s size at first maturity (Lc < Lm). This strongly implies the tendency of Indian mackerel resource overexploitation in Sumpang Binangae or Barru waters. Since most captured Indian mackerels were immature from the perspective of gonadal development, the captured Indian mackerels never reproduced. On the other hand, sustainable fishing management can be achieved if 90% of the catch has reproduced or reached the optimum size, promoting a more stable and sustainable fish stock and biomass recruitment process.
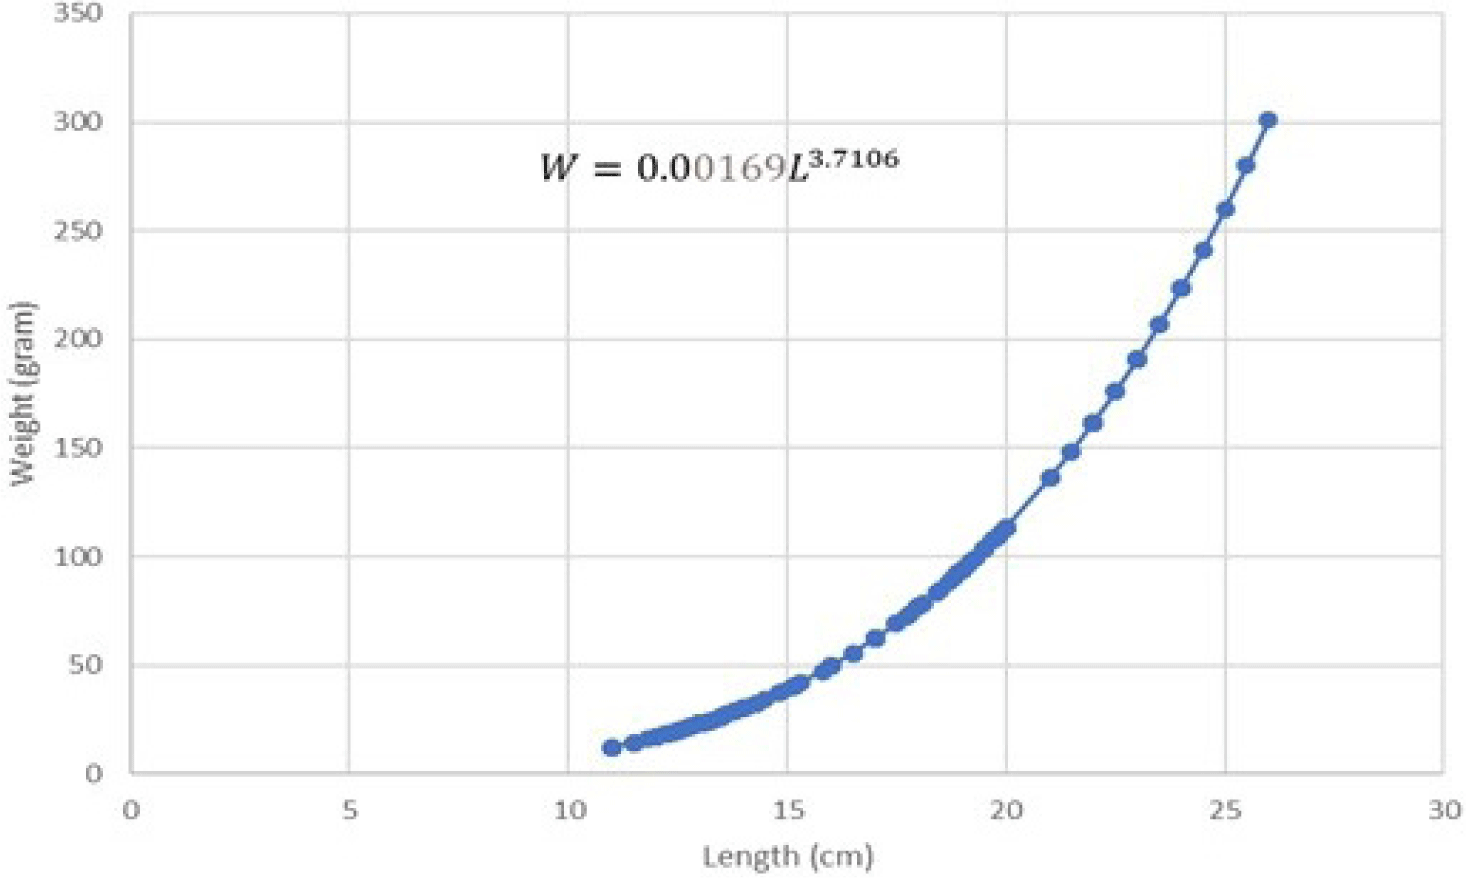
The regression equation results on both male and female length-weight relationship can be seen in Figs. 5 and 6.
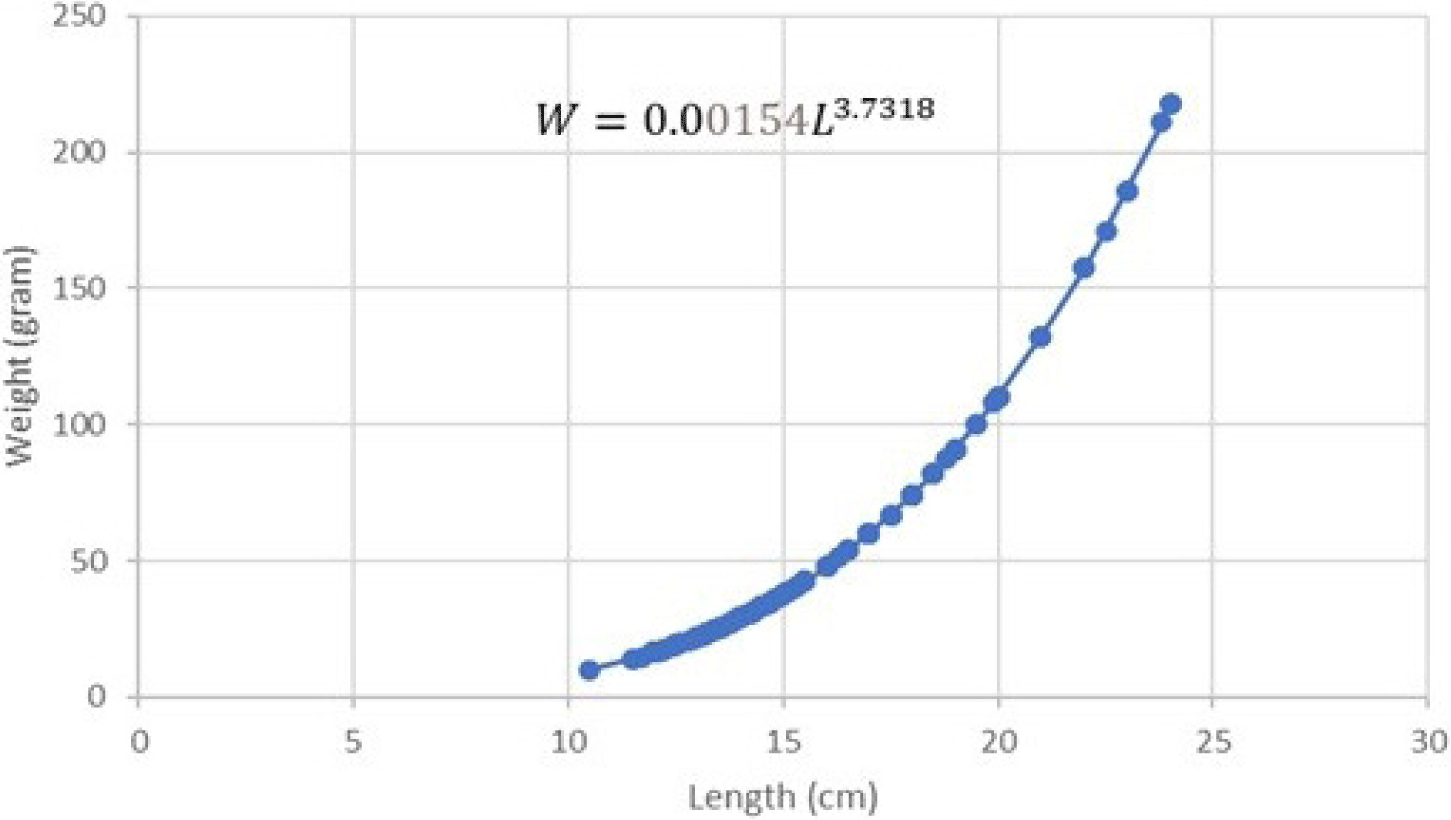
The results of the regression equation indicated that intercept (a) = 0.00154 and slope (b) = 3.7318 with r-square (R2) = 0.9568. The length-weight relationship of male Indian mackerel indicated W = 0.00154L3.7318. T-test results on the b value of male Indian mackerel indicated that tcount is higher than ttable (tcount > ttable). This implies that b is higher than 3 (b > 3). The results reflected a positive allometric growth pattern in male Indian mackerel from Barru waters.
The results of the regression equation indicated that intercept (a) = 0.00169 and slope (b) = 3.7106 with r-square (R2) = 0.9791. Length-weight relationship of female Indian mackerel indicated W = 0.00169L3.7106. T-test results on the b value of female Indian mackerel indicated that tcount is higher than ttable (tcount > ttable). This implies that b is higher than 3 (b > 3). Such result confirmed a positive allometric growth pattern in female Indian mackerel from Barru waters.
Both results confirmed a positive allometric pattern of length-weight relationship in male and female Indian mackerel catches from Barru waters. The growth pattern of the Indian mackerel’s body shape implies the dominance of weight gain compared to length gain. Positive allometric growth indicates that the fish gets comparatively stouter or deeper-bodied as it increases in length. In contrast, negative allometric growth suggests the fish gets slenderer as it increases in weight.
Other studies that observed the length-weight relationship of Indian mackerel also confirmed positive allometric growth patterns. A study performed by Saputra & Taufani (2021) suggested that captured Indian mackerel on the North Java Coast has b = 3.19 (b > 3). Parawangsa & Tampubolon (2023) similarly found a tendency of positive allometric patterns in the Indian mackerel length-weight relationship. However, a study by Abubakar et al. (2019) reported that the growth pattern of female Indian mackerel (R. kangurta) loaded in Nibung Bay, Tanjung Balai, North Sumatra has a negative allometric pattern (b = 1.8026), while the regression coefficient for male mackerel was 3.038 indicating the male Indian mackerel have isometric growth pattern. A similar negative allometric trend was also observed in studies performed by Caesario et al. (2022), where the length-weight relationship of captured Indian mackerels from Lampung waters demonstrated a negative allometric pattern marked by the growth coefficient value (b < 3). Another negative allometric growth pattern was observed from the captured Indian mackerels from the Palaw coast and the surrounding area in Taninthayi, Myanmar, with b = 2.79 (Aye & Tint, 2020).
Nguyen et al. (2023) reported that numerous factors affect growth pattern tendency in fish. These factors may differ due to environmental conditions, food availabilities, sub-species variation, gonadal development, and reproductive cycle. Generally, a positive allometric trend is observed in waters with favorable environmental conditions and abundant food for aquatic organisms that contribute to weight gain in contrast to negative allometric patterns. Such a claim is further supported by a study performed by Malik et al. (2020), finding that Barru waters conditions are still feasible for the growth and development of aquatic species, including Indian mackerels. Observation of aquatic chemical and physical factors also supported phytoplankton and zooplankton living and breeding in these waters. This suggests that rich waters with food and nutrients could potentially shape the tendency of positive allometric patterns.
The Results on Population Dynamics include:
The results of the analysis of the fork length mode grouping of Indian mackerel showed that there were three age groups. These results are based on the total cohort and monthly analysis of Indian mackerel (R. kanagurta) using the Bhatacharya model (Fig. 7).
Three cohorts or age groups were identified based on the Bhatacharya analysis model (Fig. 7). It is suspected that the fishermen used inaccurate fishing gear to catch Indian mackerels in Barru waters, leading to low selectivity and catches containing all age groups, including immature fish that never reproduce. Such practices will disturb the replenishment of the Indian mackerel population and negatively alter the relative abundance of a species in aquatic communities. Moreover, this will also negatively affect aquatic fertility, ecosystems, biomass, age at first maturity, or food chain dynamics (Walters & Martell, 2004).
Results of age group analysis showed that Indian mackerel (R. kanagurta) in Barru waters consisted of 3 age groups. Each age group had a different average length range (Table 4). The difference in the number of cohorts caught was probably due to the recruitment (entry) of new individuals from Indian mackerel spawning in the previous months. Therefore, two cohorts were found in the following month. The comparison of relative age, length mode, and population is presented in Table 4.
| Age group | Average length (cm) | Population |
|---|---|---|
| 1 | 13.18 ± 1.14 | 1,055 |
| 2 | 16.78 ± 1.75 | 182 |
| 3 | 22.28 ± 0.98 | 62 |
Table 4 shows that age group 1 shows a lower average length of 13.18 cm compared to age groups 2 and 3. Age group 3 shows the highest average length of 22.28 cm.
The analysis results on growth parameters employing average fish length data from each age group, including growth rate coefficient (K) and asymptotic length (L∞) of Indian Mackerel (R. kanagurta). The theoretical value (t0) when the fish length equals zero can be determined using the growth estimation method by Pauly (1980). The K, Linf, and t0 of Indian mackerel (R. kanagurta) in Barru waters are presented in Table 5. The estimation results using the Von Bertalanfy curve method are presented in Fig. 8.
| Parameter | Value |
|---|---|
| Growth coefficient (K) | 0.46 / year |
| L asymptote (Linƒ) | 29.5 cm |
| Log (–t0) | –0.4466 |
| t0 | −0.3576 / year |
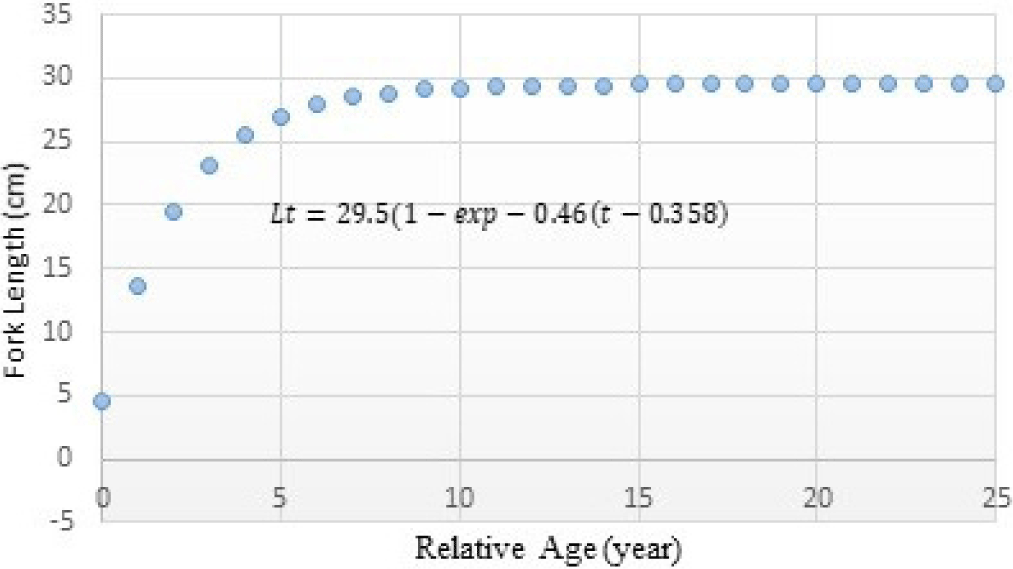
The Indian mackerel’s growth curve is presented in fork length and relative age where Lt = 29.5 (1–exp–0.46 (t–0.358)). The curve can be seen in Fig. 8 below.
The results indicated that the Indian mackerel caught in Barru waters have not yet reached the maximum fish length (L∞ = 29.5 cm) and has a rather slow growth rate, as indicated by K < 0.5 (0.46/year). Such a finding is an indication of existing Indian mackerel fish overexploitation.
Scientific information related to biological aspects, including growth parameters, is one of the fundamental factors for population management in an aquatic area. The growth parameters of fish population dynamics, such as asymptotic length (L∞) and growth coefficient (K), are critical for stock assessment and fisheries management. The growth coefficient (K) is a parameter of the von Bertalanffy growth function, expressing the rate at which the asymptotic length is approached. Short-lived species, particularly tropical fishes, attain their asymptotic length (L∞) in a year or two, and such species have a high growth coefficient (K) value. Aquatic organisms usually have a low reproductive potential, while aquatic organisms in small water bodies have a shorter theoretical life but a high reproductive potential (Allan et al., 2021).
The long-lived species usually have a low growth coefficient (K) and need many years to attain their asymptotic length (L∞). Such long-lived species have flat growth curves, and the Indian mackerel growth curve in Fig. 8 similarly reflects this. The initial parameter condition of the t0 value is negative because of the uncertainty of the initial age of fish birth determination.
Damora et al. (2021) stated that fish with a high growth rate coefficient value (K) have a high growth rate and need a short time to reach their maximum length. Meanwhile, fish with a low coefficient rate need longer to reach their maximum length. This implies that Indian mackerel from Barru waters was a fast-growth type at a young age and tended to grow slower down constant when reaching the asymptotic length. They also proposed that K = 1.0 year/indicates fast growth, K = 0.5 year/moderate growth, and K = 0.2 year/indicates slow growth, suggesting that Indian mackerel samples in the present study grow at an almost moderate growth rate. Another interpretation of these number.
As a comparison, previous studies have attempted to identify the following growth parameters.
As can be seen from Table 6, these generated values in growth parameters from different sampling sites did not show any specific patterns; rather, they had random trends of differences. Such random differences in growth parameters can be affected by several biological and ecological aspects such as nutrition, temperature, oxygen concentration, salinity, and photoperiod. However, differences in the sampling duration, season, fish size, and fishing area can also affect growth parameters during the sampling. A recent study by Lelono et al. (2023) also suggested that spatial stock difference might contribute to the variation of the growth coefficient, which most probably could be similar to the differences in Indian mackerels’ growth parameters across different sampling sites.
| No. | Sources | Sampling site | Sampling year | L∞ | K | t0 |
|---|---|---|---|---|---|---|
| 1 | Roonjha et al. (2021) | Gadani, Pakistan | 2017–2018 | 27.83 cm FL | 1.60 | –0.60 |
| Sonmiani, Pakistan | 2017–2018 | 24.73 cm FL | 0.46 | –2.83 | ||
| Kund Malir, Pakistan | 2017–2018 | 23.63 cm FL | 0.62 | –2.07 | ||
| 2 | Sonodihardjo & Yahya (2015) | Pancana Coast, Indonesia | 2013 | 29.82 cm FL | 0.47 | –0.33 |
| 3 | Rehman et al. (2019) | Northern Arabia Sea, Pakistan | 2008 | 24.57 cm FL | 0.84 | –0.74 |
| 4 | Faizah et al. (2018) | Kwandang Waters, Indonesia | 2012 | 27.30 cm FL | 0.80 | NA |
| 5 | Oktaviani et al. (2014) | Mayalibit Bay, Indonesia | 2011–2012 | 28.40 cm FL | 0.97 | NA |
| 6 | Aye & Tint (2020) | Taninthayi, Myanmar | 2017–2018 | 28.88 cm FL | 0.55 | –0.29 |
| 7 | Wardani (2017) | Probolinggo, Indonesia | 2017 | 27.60 cm FL | 0.23 | –0.74 |
| 8 | Fauzi et al. (2020) | Aru waters, Indonesia | 2020 | 27.90 cm FL | 1.33 | –0.12 |
| 9 | Present study | Barru waters, Indonesia | 2022–2023 | 29.50 cm FL | 0.46 | –0.57 |
The study performed by Roonjha et al. (2021) at different sites in Pakistan waters revealed that although the Indian mackerels originated from neighboring waters, they may demonstrate significantly distinctive growth coefficient rates (Gadani = 1.60, Sonmiani = 0.46, Kund Malir = 0.62). Some areas from both Indonesian waters (Kwandang Waters, Aru Waters, and Mayalibit Bay) and Pakistan waters (Gadani and North Arabian Sea) indicated a high growth coefficient or K > 0.5. Other sampling sites indicated moderate growth coefficients, such as in Kund Malir, Pakistan, and Thaninthayi, Myanmar, followed by low growth coefficient rates from Sonmiani (K = 0.46), Pancana (K = 0.47), Barru waters (K = 0.46), and Probolinggo (K = 0.23). These random patterns also promoted the importance of population dynamics surveys per location to achieve a more accurate fisheries management with sustainability regarding repopulation. The growth coefficient rate in the present study was K = 0.46. The values indicate an almost moderate growth coefficient, which implies that Indian mackerels from Barru waters still require extra time to achieve optimal length, which poses a threat of a challenging repopulation cycle.
The main indicator commonly used as a management reference is Lc50, a 50% fish escape and capture standard probability. This implies that only 50% of the fish will die, while 50% will continue to breed and reproduce. The Lc50 graph in the present study can be seen in Fig. 9.
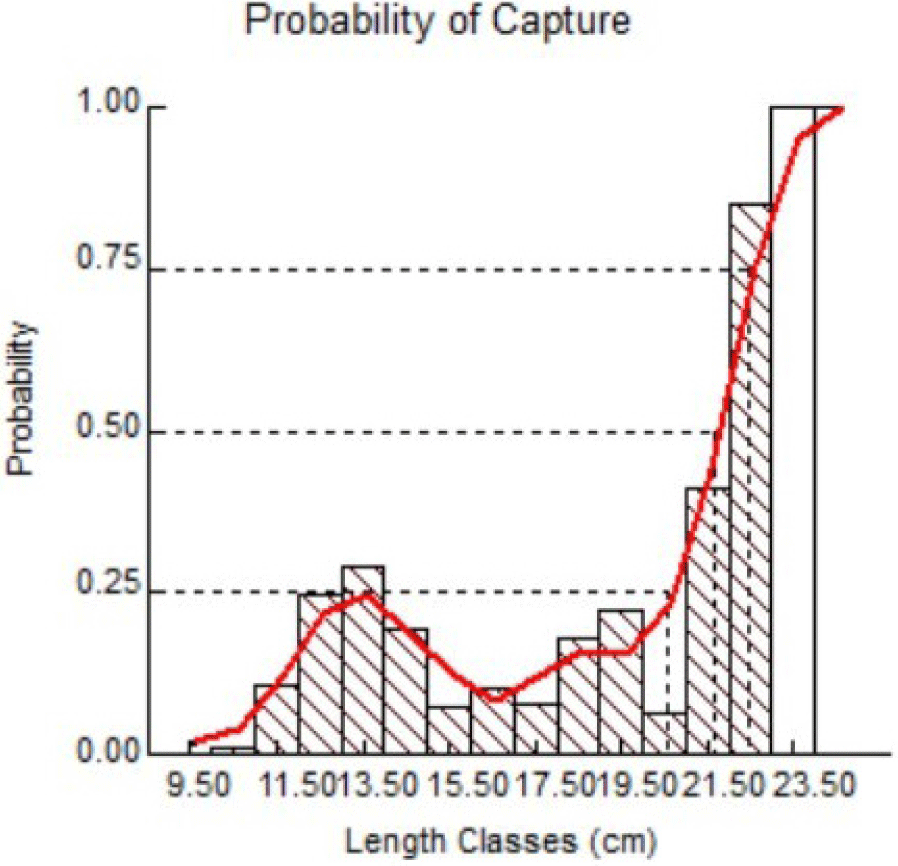
Results of FiSAT II analysis suggested Lc50 = 21.69 cm, implying that to sustain Indian mackerel stocks in Barru waters, a minimum length at first capture of 21.69 cm is strongly recommended. The results of the present study also imply that most of the captured fish were still immature and had no chance to perform reproduction and annual spawning. Unlike studies performed by Tangke (2014) with suggested Lc: 14.90 cm for Indian mackerels from Ternate Island, other studies suggested > 21.8 (Fauzi et al., 2020) and > 20.71 in length as standard Lc (Oktaviani et al., 2014). In foreign waters such as the Egyptian Red Sea, a maturity length of 50% in males was 20.4 cm and 20.53 cm in females (Osman et al., 2021). However, a lower standard of 14.39 cm was suggested in Taninthayi waters, Myanmar (Aye & Tint, 2020).
The total mortality of Indian mackerel in Barru waters was estimated using a converted catch curve through FiSAT II software, which can determine the Z value followed by the estimation of natural mortality rate (M), fishing mortality (F), and exploitation rate (E). The exploitation rate (E) is obtained by dividing fishing mortality (F) by total mortality (Z). In a stock that has been exploited, it is necessary to distinguish fishing mortality and natural mortality. According to King (1995), the total mortality (Z) is the sum of the fishing mortality rate (F) and the natural mortality rate (M).
Indian mackerel’s total mortality rate (Z) is estimated using a linearized catch curve based on length data. Estimating the total mortality rate (Z) in Indian mackerel was performed by estimating the length-converted catch curve using FISAT II software v. 1.2.2. L∞ and K were included. The calculation results generated Z = 2.67/year; therefore, this total mortality rate consists of the natural and fishing mortality rates. The FiSAT II software processing results are presented in (Fig. 10).
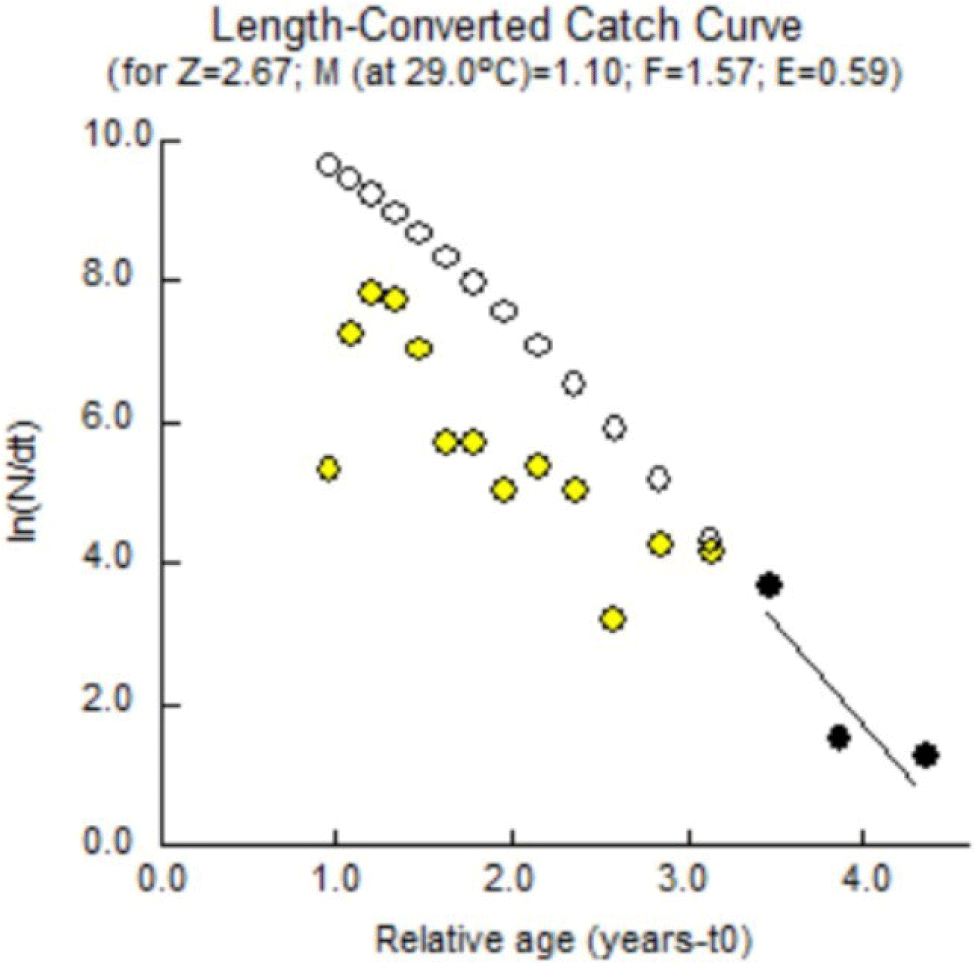
Natural mortality is mortality that occurs for reasons other than capture, such as predation, cannibalism, disease, spawning stress, starvation, and age. Individual deaths in a population may be caused by several factors, including nature (environment) and fishing activities. Causes of death from natural factors include food shortages, water pollution, disease, predation, extreme temperatures, competition, and others. In contrast, death due to natural factors is known as natural mortality (M) (Björnsson et al., 2022). Death due to fish exploitation from nature by various fishing activities is known as fishing mortality (F). The complete estimated mortality rate is presented in Table 7.
| Mortality rate | Estimated value (per year) |
|---|---|
| Total mortality (Z) | 2.67 |
| Natural mortality (M) | 1.10 |
| Fishing mortality (F) | 1.57 |
| Exploitation rate (E) | 0.59 |
The results of the FiSAT II analysis showed that the total mortality was 2.67, the natural mortality was 1.10, the fishing mortality was 1.67, and the exploitation rate was 0.59. Natural mortality of 1.10/year is considered low. Pauly (1984) states that natural mortality (M) reaching 1.5/year is considered high. Natural mortality is mostly caused by high temperature, disease, predation, low oxygen, and low pH. The low natural mortality rate in the present study reflected a good adaptability of Indian mackerel to the current dynamics of the aquatic environment.
The fishing mortality rate of 2.67/year, represented in Table 7, was much greater than the natural mortality rate. This indicates that Indian mackerel (R. kanagurta) captured from Barru waters experienced uncontrolled fishing practices. Therefore, it is necessary to evaluate the capture practices, fishing methods, and fishing gear.
The tendency to overfish is also significantly indicated by an exploitation rate of 0.58/year. This implied that 59% of Indian mackerel mortality is promoted by fishing pressure. Based on the optimum rate concept developed by Pauly (1984), the optimal exploitation rate is reached if the rate equals 0.5/year (Eopt = 0.5/year). If the exploitation rate is indicated to be E > 0.5, there is a strong presence of overfishing practices. Following the optimal exploitation rate concept, 0.59/year of exploitation rate in Indian mackerels from Barru waters has already passed the threshold of the optimal exploitation rate of 59% out of Eopt = 0.5/year.
From the study performed by Wardani (2017), it was found that total mortality (Z) was 1.66 per year, natural mortality (M) was 0.72 per year, fishing mortality (F) was 0.94 per year, and exploitation rate was 0.57 per year. Exploitation rate > 0.5 is an indicator of overfishing. Natural and fishing mortality in this study was lower than in the findings by Abdussamad et al. (2006), who reported that natural and fishing mortality during the study period was 6.43 and 3.82, respectively. The results of the studies by Ghosh et al. (2016) indicated that natural fishing and total mortality were 2.06, 3.69, and 5.75, respectively. The findings in the present study were higher than the findings in the study performed by Amin et al. (2014), where the total mortality (Z) was estimated at 1.917, the natural mortality (M) was 0.72, and the fishing mortality (F) was 1.197, growth coefficient was > 1.20 per year, and a natural mortality coefficient of 2.06 per year. The M/K ratio of 1.72 was within the normal range of 1–2.5, as Beverton & Holt (2012) suggested.
The relationship between exploitation rate and yield per recruitment can be used to assess whether the current rate of exploitation (E) is optimal, not optimal, or excessive compared with the Indian mackerel population’s ability in recruitment or the current Y/R. Exploitation rates can affect fish stocks and the sustainability of fishing industries. Y/R and B/R recruitment of Indian mackerel can be seen in Fig. 11.
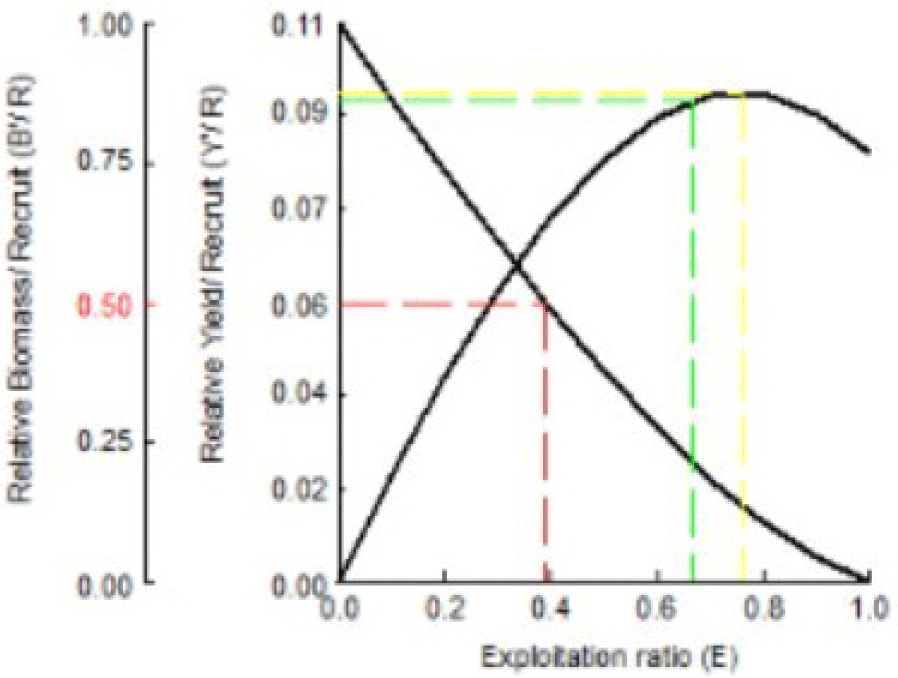
The results in Fig. 11 indicate that the present level of exploitation rate (Ecurrent = 0.59) was higher than the optimal exploitation rate (Emax = 0.378), which maintains 50% of the stock biomass as spawning stock (Ecurrent < Emax). This indicates that the exploitation rate has far exceeded the ideal conditions. Under these conditions, optimal management effort is required to reduce the exploitation rate to Emax = 0.378. The level of exploitation should be reduced to 39%.
Fig. 11 also indicates the actual Y/R of 0.083 gram/recruitment; the optimal Y/R is 0.03 gram/recruitment. The actual Y/R value is smaller than the optimal Y/R value. This implies an ineffective recruitment process. Smaller Y/R than the optimal Y/R can also occur in populations/stocks with high exploitation rates (E > 0.5 per year). Compared to the study performed by Pawase et al. (2017), the relative value and biomass per recruitment obtained an Emax of 0.772, indicating that further recruitment efforts could lead to more mackerel catches along the research site waters.
Means of L∞ = 29.5 cm, K = 0.46, M = 1.10, F = 1.57, a = 0.00169, and b = 3.7106 were used as the inputs for VPA. The T0 value is taken as 0. The highest exploitation can be seen in Fig. 12, which was observed between the 11.5 cm and 14.5 cm length classes. Such result further confirmed the overexploitation of immature fish at the research site of the present study. Compared to the study by Mustafa & Ali (2003) in the Bay of Bengal, the highest level of exploitation, as indicated by VPA, was between 16 and 22 cm.
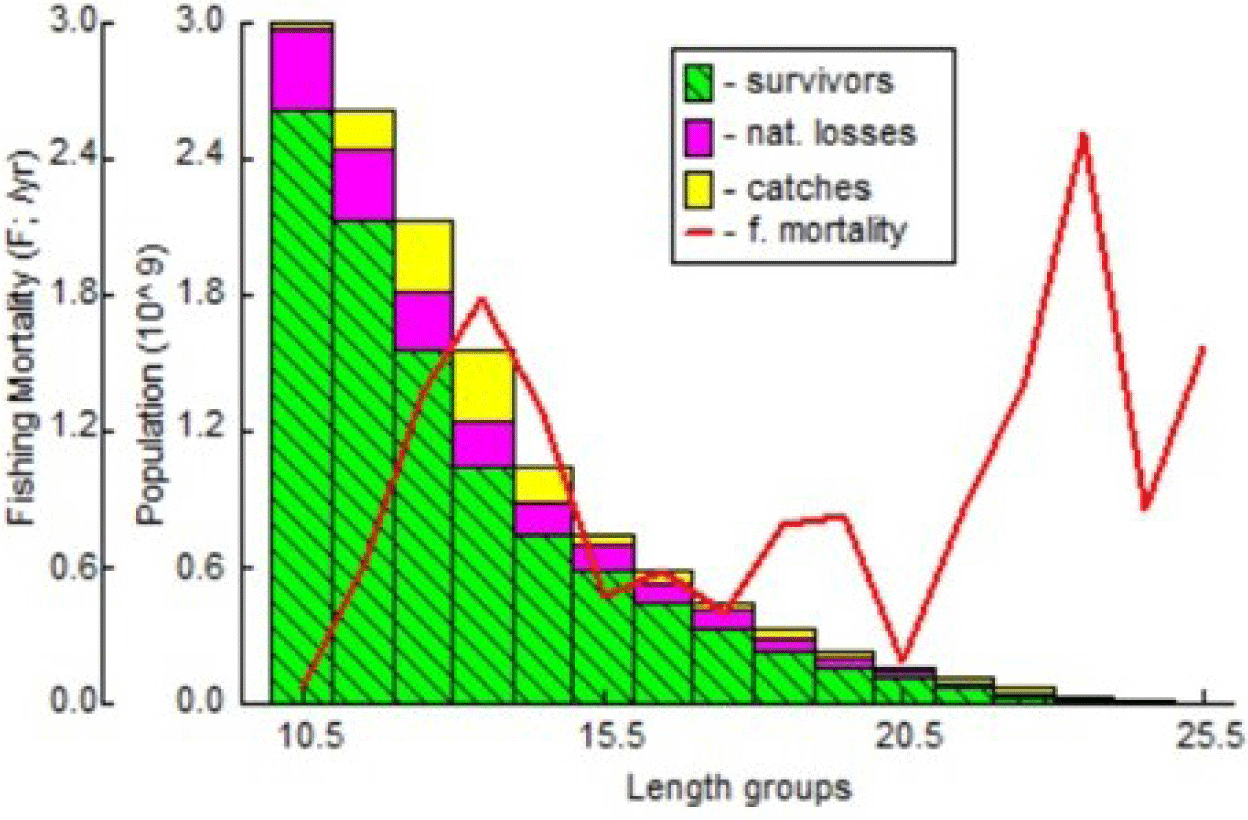
Results of yield and stock prediction are illustrated in the following Table 8.
Results from Table 8 suggested that the most contributive length class to the fisheries is 23.5 cm (FL). This can be observed from the high fishing mortality level reaching 2.51 with yields of 3.885 tons. Any increase in fishing mortality will result in lower yields. The generated virtual analysis indicated that fish yield in the present study accounted for 467.07 tons/year. Meanwhile, the recommended Indian mackerel yield is 233.53 tons/year to ensure population sustainability, as represented in Table 8. The present study’s findings imply that the fish yields exceeded the recommended yield for Indian mackerels in Barru waters. Therefore, re-evaluation and proper management for total capture, fishing gear units, and capture frequency are necessary.
Conclusion
Length or size at first gonadal maturity in Indian mackerel (R. kanagurta) ranged from 17.98–19.28 cm FL and 17.98–19.27 cm FL in females and males, respectively. The GMSs identified during the study included GMS I, GMS II, and GMS III. The length-weight relationship of Indian mackerel (R. kanagurta) reflected a positive allometric pattern in both males and females. Age group identification using a method by Bhattacharya revealed three age groups. The asymptotic length (L∞) of Indian mackerel (R. kanagurta) was 29.5 cm. Total mortality (Z) was 2.67 per year (fishing mortality is greater than natural mortality). The analysis of the exploitation rate of Indian mackerel from Barru waters indicated a tendency of overfishing at a rate of 59%. From the overall analysis of Indian mackerels’ biological aspects and population dynamics and as an input for the fisheries management policymakers in Barru, the findings in the present study proposed that to sustain better repopulation of Indian mackerels for continuous catches, an optimal catch length of 19.28 cm for male and 19.28 for female Indian mackerels should be adopted in the fisheries standard regulation. VPA analysis on fish yields and stock estimation also indicated that the most exploited fish length group was between 11.5 cm and 14.5 cm, with an exceeding current yield of 467.07 tons/year. A fish yield of 233.53 tons/year is recommended to ensure population sustainability.