Introduction
In marine fish cage farms, various issues are emerging. Limiting aquaculture development due to contamination by aquaculture pollutants. High rates of feed loss have also been identified as a problem (Islam, 2005). Additionally, aquaculture pollutants precipitate in the sedimentary layer, leading to organic matter accumulation, causing eutrophication and oxygen depletion, reduced productivity and biodiversity (Rabassó & Hernández, 2015), and inducing mortality in fish and benthic organisms.
Various studies are currently underway to address these challenges. Strategies such as integrated multi-trophic aquaculture (IMTA), nearshore aquaculture development, the development of indicators for environmental management, carrying capacity estimation, estimate of optimal management plans, and optimal site selection are being explored as potential solutions to these problems. Among various research methods, modelling is increasingly recognized as a crucial tool for decision-making in the environmental management of fish farms (Brigolin et al., 2014). It possesses a strong advantage in enabling the implementation of various scenarios for management purposes (Nobre et al., 2010). Stigebrandt (2011) emphasized the need for appropriate modelling, considering environmental and water quality standards, before aquaculture operations commence. This is due to the absence of alternative methods for estimating carrying capacity during the planning phase. Stigebrandt et al. (2004) suggested that fish models could optimize the feeding system, maximize growth, and minimize the discharge of nutrients and organic matter. The dispersion of nutrients and organic matter discharged from fish farms, along with the associated biological processes, is significantly impacted by water circulation. Therefore, integrated studies combining biological and physical processes are crucial, and this can be achieved through the application of mathematical models (Filgueira et al., 2017). In this way, modelling is considered a valuable tool for overcoming the limitations of observation and facilitating effective production and environmental management in fish farming.
Studies related to modelling in marine fish cage farms have been broadly categorized into three main objectives: fish growth modelling, sediment modelling, and 3D hydrodynamic modelling. Cromey et al. (2002), Kwon et al. (2005), and others have employed models that primarily focus on predicting the contamination level of sediment layers based on aquaculture environment information such as feed input and flow observation results. Research conducted by Brigolin et al. (2014), Cubillo et al. (2016), Ferreira et al. (2012), among others, has been dedicated to modelling fish growth and sediment layer environments. Relatively recent studies by Broch et al. (2017) and Rensel et al. (2013) have investigated research involving 3D hydrodynamic flow. Furthermore, according to Broch et al. (2017), models utilizing observed current flow values during a limited time period, similar to previous studies, were reported to have limitations in spatially overestimating or underestimating material transport compared to the actual phenomenon. In other words, current models for marine fish cage farms appear to be becoming more precise than those in the past.
In the case of South Korea, economic losses and environmental issues are arising due to high-density farming. Aquaculture environments are degrading, and pollution is causing a reduction in aquaculture productivity. However, the solutions are limited to aquaculture environmental assessments, actions based on assessment results, and mandatory aquaculture cleaning (Ma et al., 2018). These methods are relatively inadequate compared to those in advanced countries such as Norway, Denmark, and the United States. Therefore, it is considered urgent for South Korea to propose scientific approaches to address these problems. Despite this pressing need, there is currently only one modelling research case applied in South Korea, which is the study by Kwon et al. (2005) using DEPOMOD. This model is employed to assess the environmental impacts of pollutants discharged into marine fish cage farms but does not consider spatial changes in current flow patterns. Furthermore, there is a lack of modelling studies in Korea that take into account fish growth (production), which affects the quantity of pollutants discharged, despite the importance of fish production as a food source. Therefore, it is considered necessary to conduct integrated modelling studies that consider fish growth, sediment, and 3D hydrodynamics for the development of production and environmental management strategies for marine fish farms in South Korea.
This study aimed to construct and apply a model for marine fish cage farms in the South Korean sea. Furthermore, utilizing this model, various scenario analyses were conducted to derive management plans that ensure no adverse impacts on fish production and the environment.
Materials and Methods
The model utilized in this study consists of three components: a hydrodynamic model, an ecological model (water quality-sediment), and a fish growth model (Fig. 1). The results from the hydrodynamic model are utilized as the flow field input for the ecological model. Tidal currents were incorporated into the model to simulate and predict pollutant behavior, considering flow variations associated with ebb and flood tides. The fish growth model calculates fish growth, biomass(production), wasted feed production, and excretion (feces and urine) by considering feed input and variations in environmental conditions. This model is integrated with the ecological model. The byproducts (wasted feed, excretion, etc.) calculated in the fish growth model are integrated into the ecological model. Furthermore, within the sediment layer, processes such as resuspension, sedimentation, and release are considered to depict material exchange with the water column.
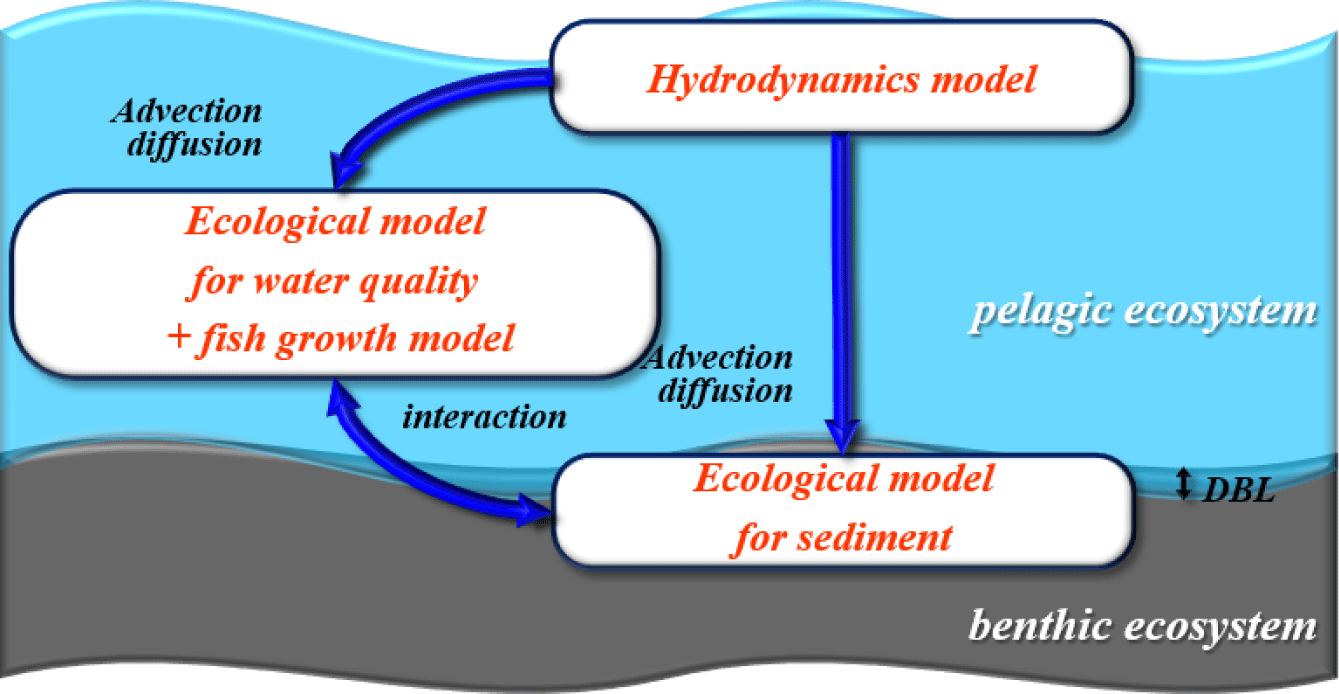
The hydrodynamic model used in this study is the Environmental Fluid Dynamics Code (EFDC). Developed by the Virginia Institute of Marine Science (VIMS) in the United States, EFDC is an EPA-certified model widely used globally. The hydrodynamic flow results were obtained from the model constructed for the study area by Jung et al. (2020). In this study, flow validation was conducted by considering velocity changes induced by structures associated with marine fish cage farms, specifically for the present study. In addition, 360 days were simulated to conduct this study.
Before utilizing the ecological model in this study, we conducted a comparative analysis between Ecosystem Model for Marine Management (EM3) and EFDC. The EFDC sediment model, was incorporated to simulate the exchange processes between sediment layers and water columns in EFDC. The model within EFDC represents the material exchange of sediment due to benthic bioturbation using the dissolved oxygen (DO) concentration in the sediment layer. However, it was deemed unsuitable for areas with frequent hypoxia, which is common in the high-density aquaculture regions of South Korea. Therefore, the applicability of the EFDC model to South Korean waters was considered limited. The EM3 utilized in this study was developed for the introduction and implementation of the first phase of the Coastal Total Pollution Load Management System in the Masan Bay Special Management Area in South Korea (MOF, 2008). EM3 allows flexibility in adding or omitting state variables and processes based on specific objectives and includes internal production factors such as chemical oxygen demand (COD). The EM3 has undergone continuous development, incorporating components for sedimentary environments (2009), modules for total nitrogen and total phosphorus for coastal pollution load management (2012), and a module for aquaculture carrying capacity estimation (2014). EM3 has been applied to the Masan Bay and Busan coastal areas for pollution load management research (2014). Furthermore, EM3 is optimized for observational data generated in South Korea. Therefore, for the ecological model (including water quality and sediment), EM3 serves as the foundation.
EM3 incorporates a fish growth model developed in this study and is structured to circulate carbon (C), nitrogen (N), phosphorus (P), silica (Si), and oxygen (O). Details not directly related to the fish growth model are extensively described in previous research and are not reiterated in this study. The pelagic ecological diagram is depicted in Fig. 2. The state variables in the pelagic layer include phytoplankton (cyanobacteria, green algae, diatom), zooplankton, COD, DO, feed, fish, wasted feed, feces, particle organic carbon (POC), dissolved organic carbon (DOC), silica, NH4-N, NO3-N, and PO4-P. The feed entering the fish farm is ingested by the fish. Uningested feed, known as wasted feed, and fish feces are introduced into the water column, where they undergo physical processes (advection, diffusion) and biological processes (decomposition, mineralization) over time. Subsequently, these components sink to the sediment layer. Prior to settling in the sediment layer, a portion of wasted feed, feces, particulate organic carbon (POC), phytoplankton (phy), zooplankton (zoo), and DOC may be ingested by suspension feeders in the sediment layer. To calculate the DO concentration affecting fish survival, inorganic mineralization (oxic, suboxic, and anoxic) in the water column is considered based on the DO concentration in the water column. The benthic ecological diagram is illustrated in Fig. 2. The state variables in the benthic layer consist of benthic algae, deposit feeders, suspension feeders, POC, DOC, DO, wasted feed, feces, NH4-N, NO3-N, and PO4-P. Wasted feed and feces sinking from the water column undergo physical processes, including bioturbation, diffusion, and irrigation, as well as biological processes such as decomposition, mineralization, and ingestion by deposit feeders and suspension feeders. Over time, these components undergo sediment burial processes and settle beneath the sediment layer. At the boundary between the water column and the sediment layer, material cycling of DO, silica, NH4-N, NO3-N, and PO4-P is exchanged based on concentration gradients. The overall organic carbon contamination level in the sediment layer, evaluated as total organic carbon (TOC), is represented as the sum of POC, DOC, wasted feed, and feces.
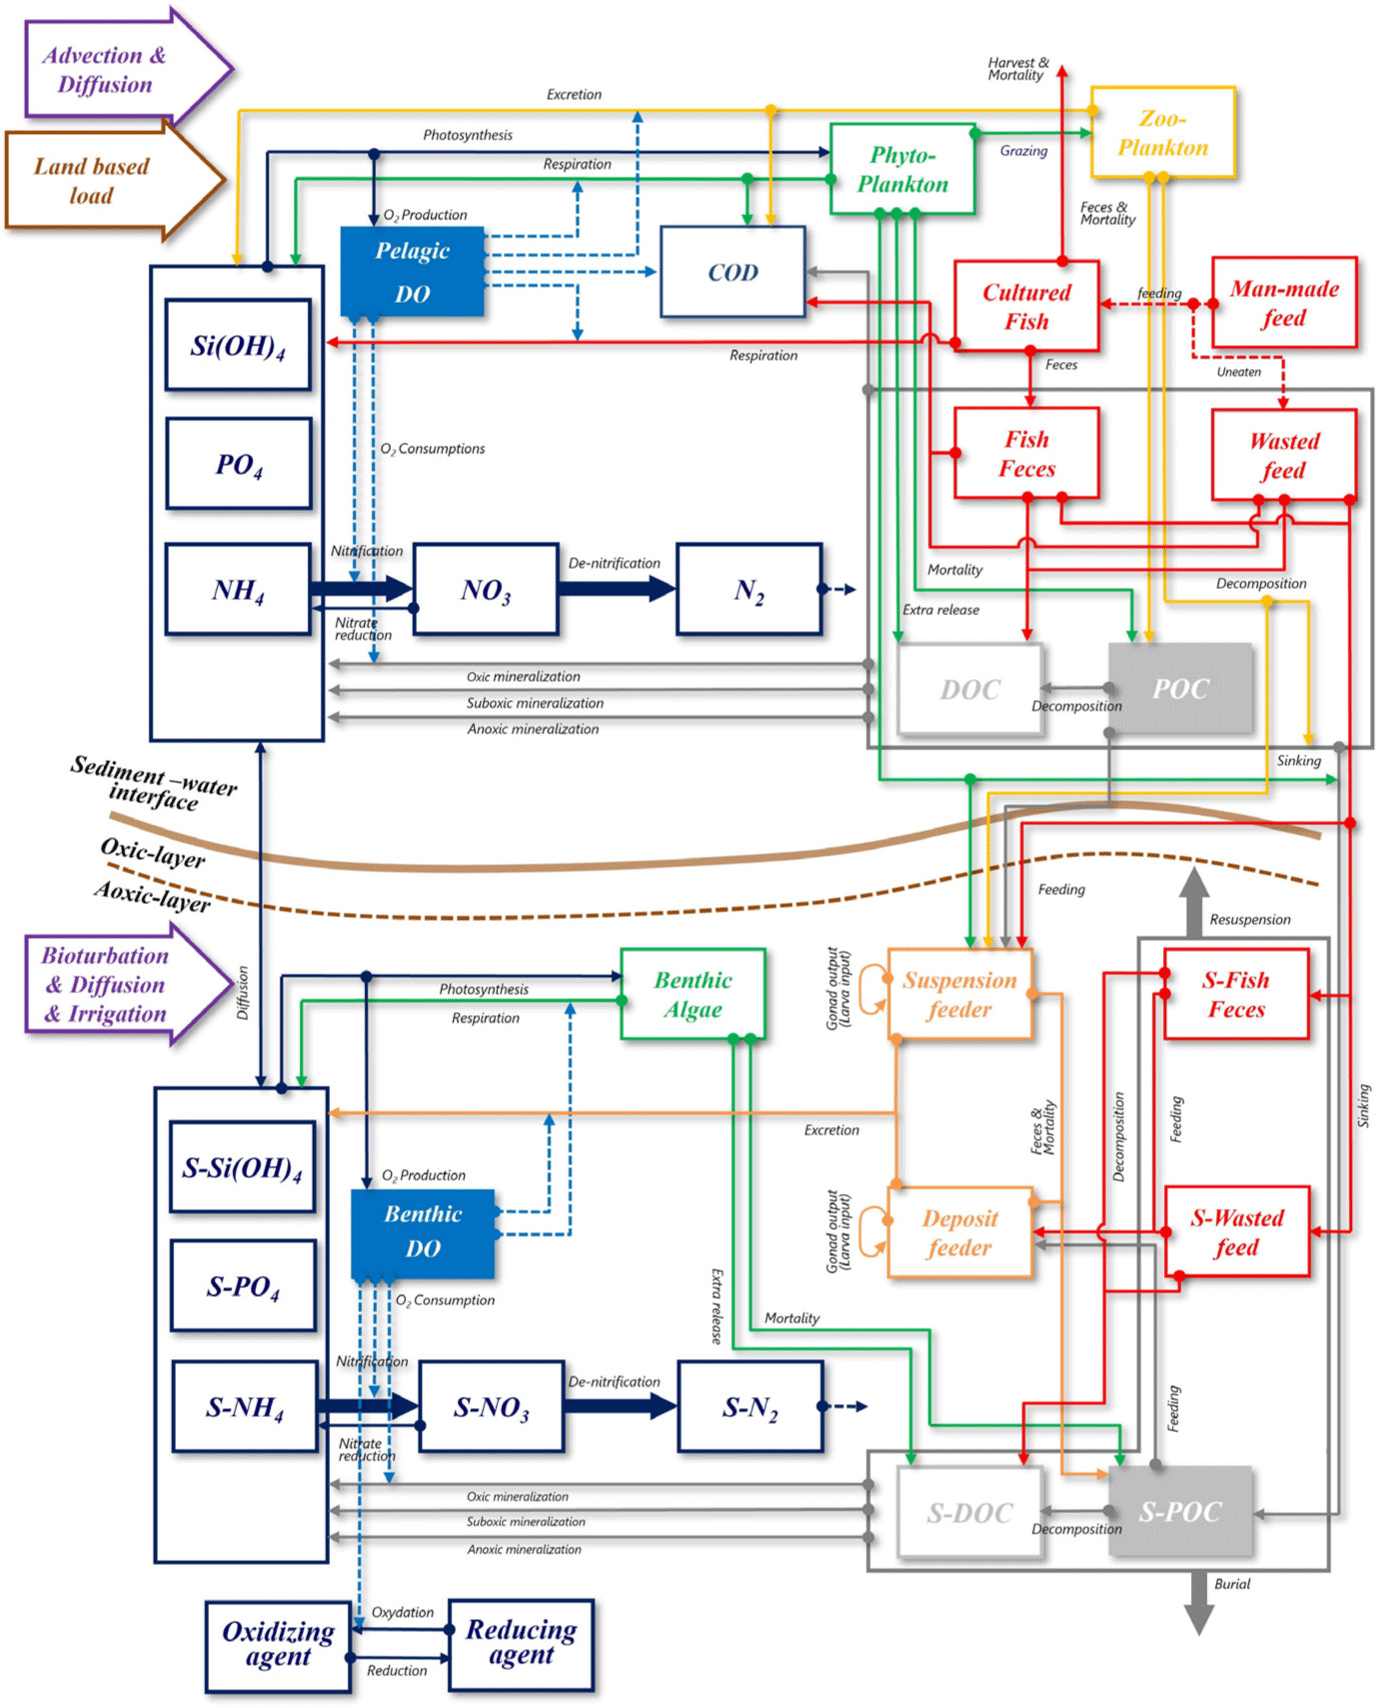
When examining the currently developed fish models, Rensel et al. (2013) is based on a carbon unit, while Brigolin et al. (2014), Ferreira et al. (2012) are based on energy units. The fish model in this study is presented in carbon (C) units. According to Rensel et al. (2013), understanding the fish metabolism is most easily comprehended in terms of carbon budget. Additionally, considering the available water quality and sediment observation data held by our research team, and the existing models based on Carbon (C), developing a model in carbon units was deemed the most suitable approach. The excretion resulting from respiratory processes is expressed in terms of N and P. Furthermore, oxygen consumed due to fish respiration is configured to be consumed in the water column of the ecological model. Wasted feed, fish feces, and urines are structured to enter the water column, originating from the aquaculture system.
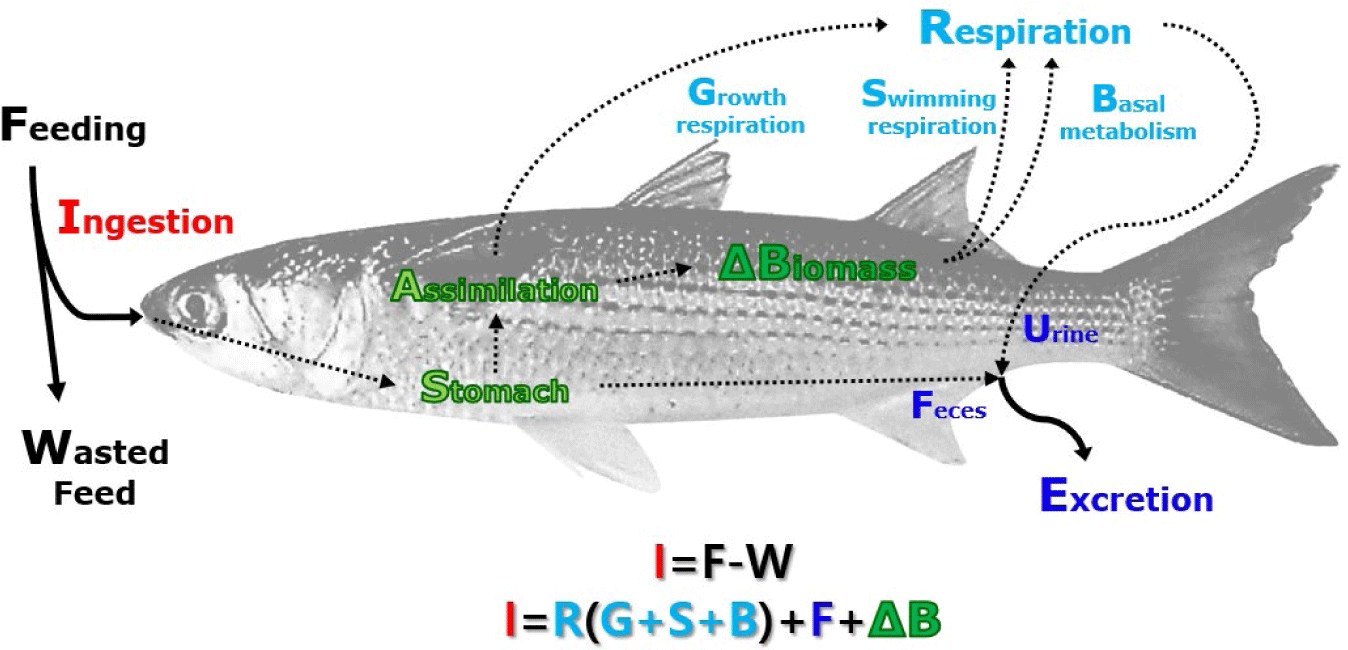
The diagram for the fish growth model is presented in Fig. 3, and the overall equation is depicted in Equation (1). Although 'biomass' and 'production' are not entirely identical in meaning, for consistency and to avoid confusion, the term ‘production’ is used in sections following the 'Fish-growth model'.
The biomass of fish is defined through ingestion, respiration, and excretion processes. The ingestion process is determined by the fish’s ability to consume feed, influenced by factors such as fish length, weight, stomach capacity, feed supply, and water temperature. Assimilation is defined as a function of stored feed during the ingestion process, assimilation rate, and DO concentration. Respiration includes oxygen consumption and the excretion of nitrogen (N) and phosphorus (P), classified into three processes: basal metabolism, swimming respiration, and growth respiration. Basal metabolism is a function of water temperature, fish size, and stocking density. Swimming respiration is defined as a function of fish surface area and flow rate. Growth respiration is proportional to the assimilation process. The occurrence of wasted feed happens when the feed supply exceeds the fish’s ingestion capacity, and the unconsumed feed is introduced into the water column as wasted feed. Fish wet weight is calculated using observed moisture content and carbon content of fish. The total biomass of fish is calculated by multiplying the individual fish biomass by the number of individuals. The key outputs of the fish model are time-series values for fish growth, respiration, ingestion, and excretion in response to changes in feed supply and environmental conditions over farming periods.
Ingestion refers to the actual external feeding intake of fish, encompassing ingestion, excretion, assimilation, and the remaining feed in the stomach. It is regulated by limit factors such as feed supply, stomach capacity, temperature, and DO. The ingestion formula applied in this study is an adaptation of the one used by Ferreira et al. (2012). Ingestion is a function of stomach volume (SV), and as the ingestion due to feed supply reaches the stomach capacity of fish, the feed ingestion amount decreases. The use of SV as a function aims to prevent an overestimation of wasted feed and to incorporate the aquaculture conditions performed in the field into the modeling as much as possible. The stomach capacity of fish has been studied by Gosch et al. (2009). The maximum ingestion rate is calculated based on the relative growth of the fish stomach (Brigolin et al., 2014), and the temperature constraint for feed ingestion utilizes the formula from Hernández et al. (2003).
The SV is calculated as follows (Equation (2)).
Here, SV is stomach volume (mL), L is the length of the fish (mm), and aSV and bSV are coefficients for estimating SV.
The length (L, mm) was calculated using the formula of Wassef & Shehata (1991) applied to Gilthead seabream, and wet weight of the fish (Equations (3)−(5)).
Here, aL and bL are coefficients for calculating fish length, WC is the carbon weight of the fish, AQCR is the carbon content of the fish, and AQWR is the moisture contents of the fish.
As this model is based on carbon content, the SV is expressed in terms of carbon quantity (mg C) by converting it (Equation (6)).
Here, SVC represents the SV converted to carbon content, and FCR is the carbon content of the feed, while FWR is the moisture content of the feed.
The ingested feed is stored in the stomach before being assimilated. In this case, the stored feed in the stomach is defined as SC. The stored SC is represented as the amount retained, excluding the quantity absorbed into the fish and the amount excreted (Equation (7)).
Here, SC represents the volumetric stomach content (mg C), AQi is the ingestion of fish (mg C), AQa is the assimilation of fish (mg C), and AQfeces is the feces of fish (mg C).
The ingestion amount (AQi) is influenced by stomach capacity (SVC) and feed supply. The remaining stomach capacity available for feed ingestion (SCA) is the volume in the stomach (SVC) minus the existing stomach content (SC) (Equation (8)).
Here, SCA represents the remaining stomach capacity (mg C).
The remaining stomach capacity (SCA) regulates the amount of feed that can be ingested. It is adjusted by the feed supply rate. If the remaining stomach capacity is smaller than the feed supply rate, the feed ingestion is limited to the remaining stomach capacity. Conversely, if the remaining stomach capacity is greater, the feed ingestion equals the supplied feed amount. This is defined as the SIC. In this case, the feed supply rate includes the feed remaining in the farm (Equation (9)).
Here, FeedC is the carbon equivalent of the actual feed input (Feed) into the fish farm, where Feed represents the input feed amount (mg), FWR is moisture content of feed (%), and FCR is the carbon ratio of feed (%) (Equation (10)).
Earlier, the maximum feed ingestion amount that fish can ingest (SIC) was calculated. To apply this to the model calculation, the stomach ingestion rate considering the average ingestion time (Itime) was computed (Equation (11)).
The actual stomach content added, represented by the feed ingestion quantity (AQi), takes into account the temperature effect on the additional stomach content ingestion rate (SICT) as presented in Equation (11). The temperature constraint for feed ingestion utilizes the formula from Hernández et al. (2003), where the temperature constraint (ft) is expressed as a value between 0 and 1. If the temperature (T) exceeds tm, the ingestion process does not occur (Equation (12)).
Here, ft represents the Ingestion limit coefficient by water temperature (−), T is the water temperature (°C), tm is the maximum adjustment parameter (°C), αt and βt are temperature function parameters (/°C), and Dtp is the temperature adjustment parameter (−).
The final expression for the quantity of feed ingested by fish over a specific time period is represented as follows (Equation (13)).
Assimilation is expressed as the sum of growth respiration and growth. Growth respiration is mentioned in ‘Respiration’ section, and in this section, only the content related to assimilation and growth is described. The growth model proposed by Rabassó & Hernández (2015) was utilized to estimate fish size as a function of initial weight and water temperature. It was noted that the amount of supplied feed is influenced by fish size and water temperature. Stigebrandt (1999) revealed that fish growth rate varies with temperature and fish weight. Deviations from optimal temperature and salinity values, higher or lower, can impede fish growth and health. Additionally, DO was highlighted as playing a crucial role in both the growth and survival of farming species (Ferreira et al., 2012). Therefore, in this study, fish assimilation is represented as a function of fish size, water temperature, and oxygen concentration within the fish farm.
The assimilation limitation equation based on DO follows the formula employed by Rensel et al. (2013), and ranges between 0 and 1 (Equation (14)).
Here, fDO represents the assimilation limitation coefficient by DO, Slope Oxygen Lim determines the slope factor for DO limitation, and KOxygenLim is the DO concentration at which the DO limitation occurs.
Therefore, the assimilation equation is expressed as the product of the available feed amount in the stomach (Scic), the digestion rate (Rd) indicating the extent of actual assimilation, and the DO limitation function (fDO) (Equation (15)).
SCIC, the feed amount available in the stomach, is represented as the sum of AQi and SC (Equation (16)).
Respiration is divided into basal metabolism, swimming respiration, and growth respiration. Basal metabolism is the respiration that fish undergo to maintain basic metabolic processes, swimming respiration is the respiration required to maintain position in a fluid with flow, and growth respiration is the respiration that occurs during the assimilation of feed for fish growth.
Basal metabolism was adapted by modifying the energy equation used by Brigolin et al. (2014), and in this study, it is expressed as a function of fish weight, water temperature, and stocking density (Equation (17)).
Here, E_AQbr represents basal metabolism energy (kJ/day), EO2 is the energy consumption per gram of oxygen consumed during respiration (kJ/g O2), KO is the oxygen consumption during respiration per unit time per fish weight (g O2/g fish/day), w is the fish weight (g), ft is the temperature limitation coefficient (−), nbr is the weight index for basal metabolism (−), and Rdensity is the coefficient for stocking density influence (−).
In order to apply the model in this study, basal metabolism energy (E_AQbr) has been converted to carbon-based basal metabolism (AQbr) (Equation (18)).
Here, Rec represents the coefficient converting energy to carbon (1/RCJ).
The respiratory enhancement function according to stocking density is not currently well-established. Therefore, it was represented using the five-parameter logistic function, and the input coefficient values were derived through the model calibration and validation process (Equation (19)).
Here, Rdensity represents the metabolic coefficient due to stocking density, and Rden_growth_A−Rden_growth_E are the parameters of the five-parameter logistic function.
When aquaculture is conducted at high flow rates, it can lead to excessive metabolism in fish (Ferreira et al., 2012). Studies by Ferreira et al. (2012) and Rensel et al. (2013) take into account the respiratory effects of flow rates on fish. As flow rates increase, the energy that fish need to expend also increases. This results in higher feed input and extended farming periods to achieve the target biomass, leading to reduced efficiency in aquaculture. In this study, the respiratory rate modeled by Ferreira et al. (2012) (Equation (20)) was employed, with units expressed as g cal/day.
Here, E_AQsr represents the energy expended during swimming respiration (g cal/day), Cd is the drag coefficient (−), ρ is the fluid density (kg/m3), and A is the frontal area or wetted area of the fish (cm2).
To apply the above equation to the current model, it was expressed by converting from calories to joules using the coefficient (RcalJ) and then converting from joules to carbon units using the coefficient (1/RCJ) (Equation (21)).
The area (A) was calculated using the formula proposed by O’Shea et al. (2006), which is based on the fish’s biomass or body length (Equation (22)). In this equation, the coefficients a and b represent experimentally determined values.
The growth respiration processes were represented by multiplying the ratio of energy intake to assimilation rate (CSDA) (Equation (23)). The carbon quantity was denoted as AQgr, and the energy amount (E_AQgr) was expressed by multiplying AQgr with the reciprocal of the coefficient converting carbon to joules (RCalJ) (Equation (24)).
The growth (AQg) of fish was represented by the value excluding the growth respiration (AQgr) during assimilation (AQa) (Equation (25)).
The excretion from fish determines the release of C, N, and P into the fish farm. Model assists in estimating the type and quantity of discharged substances, providing initial information used to assess effluent behavior (Rabassó & Hernández, 2015). The actual quantity of feed consumed by fish and the assimilation rate play crucial roles in determining the amount of excretion. Typically, there is a correlation between the amount of feed ingested by fish and the subsequent production of excretion (Islam, 2005). Rabassó & Hernández (2015) suggested that by integrating such informations with data provided by growth models, detailed estimates of feed ingestion and overall substance excretion could be obtained. Therefore, understanding the excretion mechanism is a crucial aspect in predicting the impact of fish farming on the environment.
In this study, the excretion rate was expressed as the product of assimilation (AQa) and the excretion rate, with the excretion rate represented as '1 − assimilation rate (Ra)' (Equation (26)).
The excretion of nitrogen (N) and phosphorus (P) was expressed as the product of the sum of each respiration rate and the conversion coefficients for N and P. Nitrogen excretion (AQeN) was represented as the product of a coefficient converting energy-expressed basal metabolism (E_AQbr), swimming respiration (E_AQsr), and growth respiration (E_AQgr) to nitrogen (Equation (27)). The coefficients used in the multiplication correspond to the conversion coefficient from energy to oxygen (EO2) and the conversion coefficient from oxygen to nitrogen (RON).
The excretion of phosphorus (P), denoted as AQeP, was expressed by multiplying the nitrogen excretion (AQeN) by the coefficient (RNP) that converts nitrogen to phosphorus in the same process (Equation (28)).
In the study by Brigolin et al. (2014), the fish individual number was represented as follows (Equation (29)).
AQN represents the fish individual number, m is the natural mortality rate, and R_AQharvest is the harvest rate. The equation for natural mortality assumes a constant rate and is formulated under this assumption. The harvest rate is set to 0 on days when no harvesting is conducted.
In this study, the change in fish individual number is differentiated into input, death, and harvesting (Equation (30)).
Here, AQinput represents the number of fish into the farm. The change in carbon content of fish corresponding to the variation in individual number, is structured in the same way as the change the number of into the farm, with carbon content applied instead of population count.
In this study, the mortality rate (R_AQdeath) was utilized instead of the natural mortality rate (m). As there is no existing formula directly related to mortality, the mortality equation was adapted by modifying the optimal curve equation. The coefficients were adjusted based on experimental values. Survival rates are determined for each of the three temperature conditions according to Equations (31)−(33).
Here, Dtemp represents the survival rate (−) influenced by temperature, RTdeath is the death time (/day) based on temperature conditions, DDO represents the survival rate (−) influenced by DO, and RDOdeath is the death time (/day) based on DO conditions.
Here, ftmin (ftmax) represents the minimum (maximum) temperature impact coefficient (−), T is the water temperature (°C), Tmin (Tmax) is the minimum (maximum) temperature limit (°C), Topt1 (Topt2) is the optimal minimum (maximum) temperature (°C). Additionally, fdomin (fdomax) represents the minimum (maximum) DO impact coefficient (−), DO is the DO concentration (mg/L), DOmin (DOmax) is the minimum (maximum) DO limit (mg/L), and DOopt1 (DOopt2) is the optimal minimum (maximum) DO concentration (mg/L).
In addition, mortality increase based on stocking density was incorporated. Since there is currently no function specifically studied for mortality increase with density, the five-parameter logistic function was employed to represent it, similar to the respiratory increase function with density. The formula for mortality based on fish stocking density, like the basal metabolic rate equation based on stocking density, was derived through the model validation process. The equation for mortality based on fish stocking density is presented in Equation (34).
Here, Ddensity represents mortality based on fish stocking density, and Rden_death_A − Rden_death_E are coefficients derived through the calibration process. Density refers to the stocking density of fish.
The final equation for fish mortality is as follows: RDendeath (/day) represents the time required for fish mortality under a specific stocking density condition, derived through the model validation process (Equation (35)).
The equations related to harvest and input are as follows Equations (36), (37). Data provided by fishermen were used, and since this data is in wet weight, it was converted to carbon weight. Harvest and input were represented in the model occurring within a single timestep, given that they are temporary events.
Case study
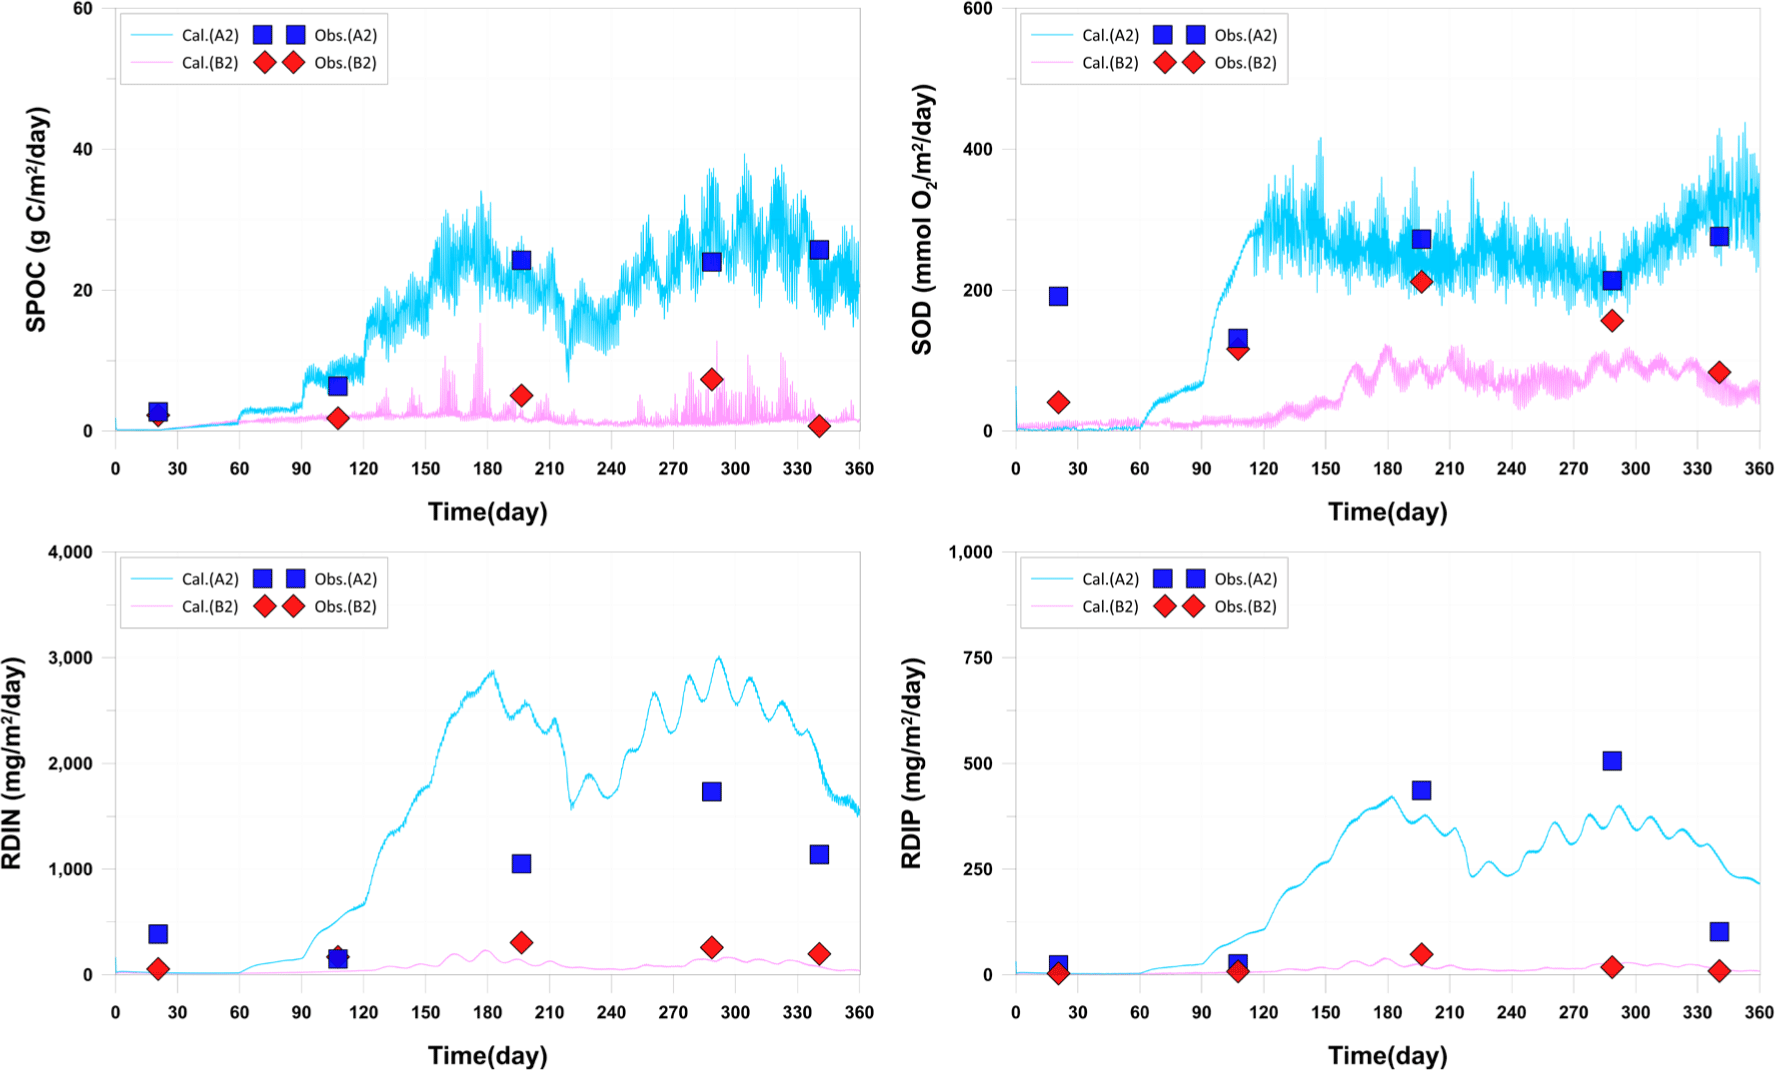
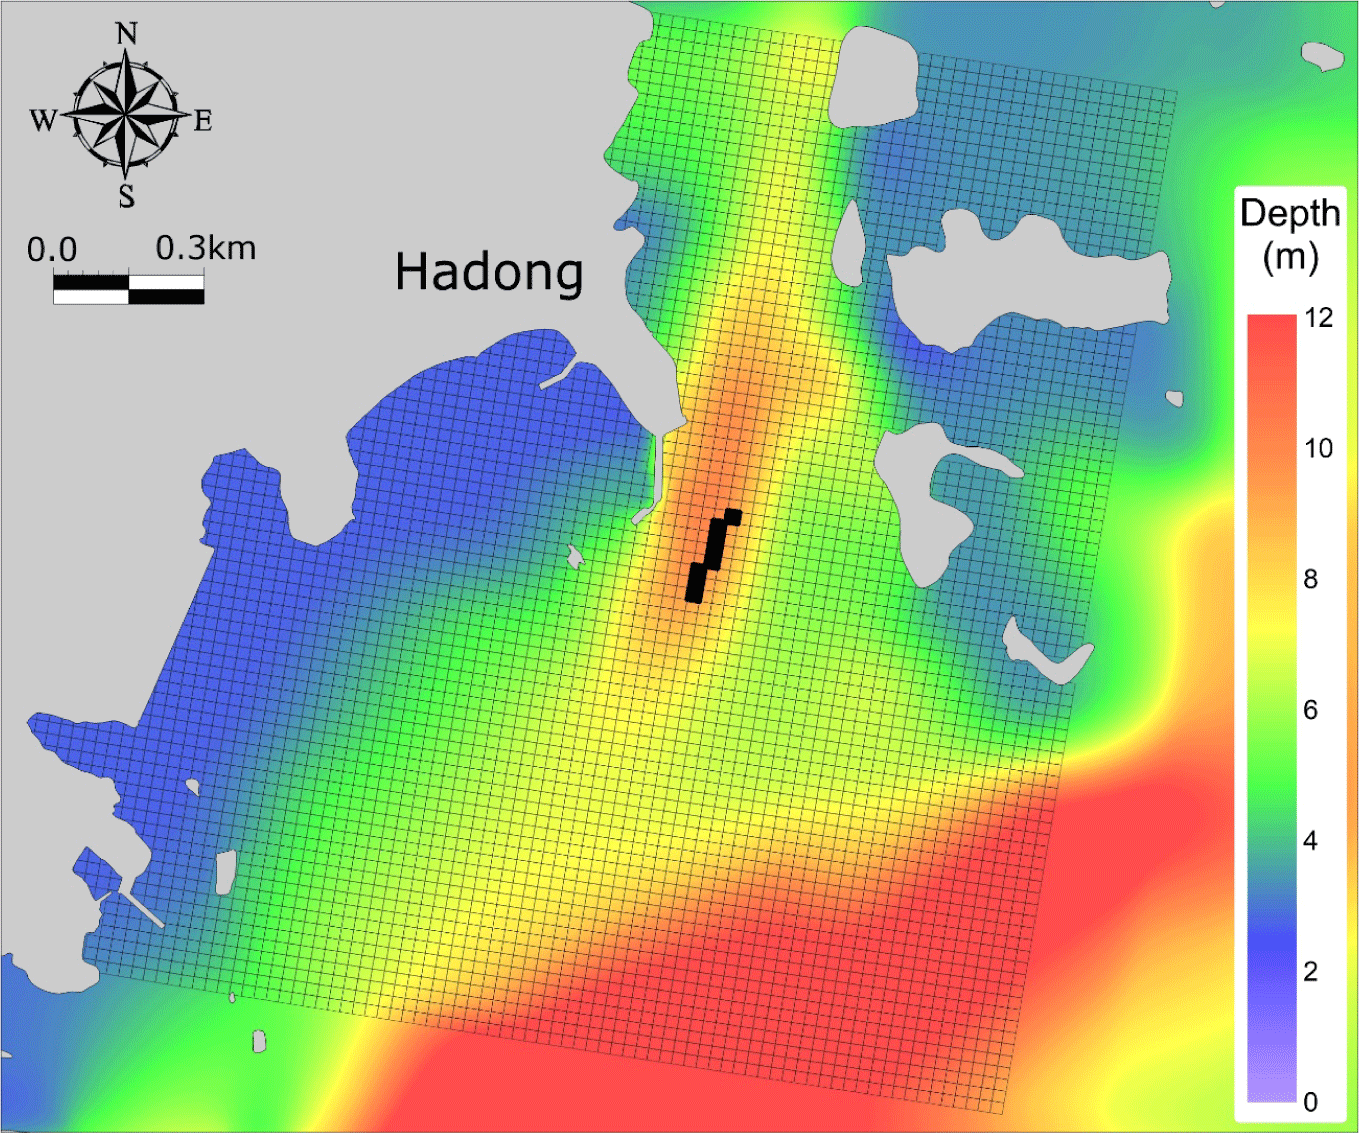
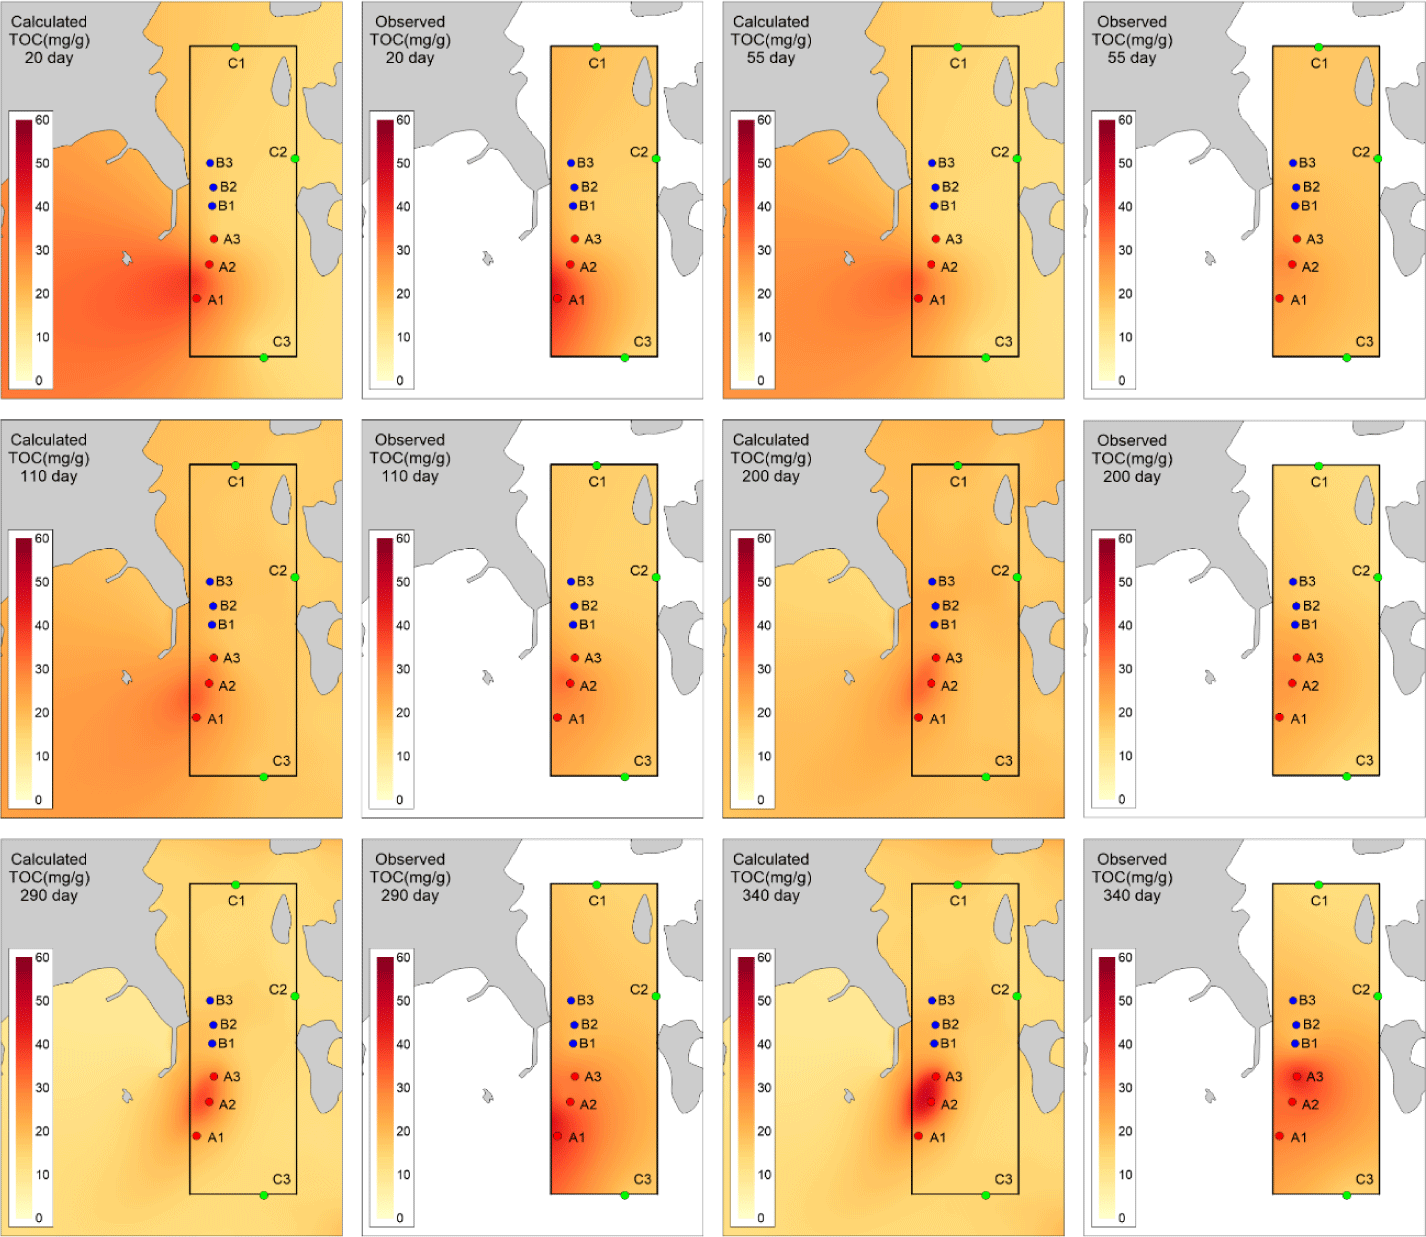
The study site is the aquaculture facility located in Hadong-gun, Gyeongsangnam-do, South Korea, and simulations were conducted for the year 2019. The farmed species is mullet (Mugil cephalus), consisting of fry (0-year), intermediate fish (1-year), and adult fish (2-year). Data pertaining to fish farming, including feed input, aquaculture facilities, mortality, current stock, etc., were acquired through on-site observations and provided by fishermen. Water quality and sediment were monitored at a total of 9 sampling points for model validation. Current aquaculture sites were labelled A1, A2, and A3, while sites with aquaculture until 2017 were labelled B1, B2 and B3. Control points were labelled C1, C2, and C3. Water quality state variables (DO, Chl.a, POC, DOC, NH4, NO3, DIP, Si) and sediment state variables (TOC) were measured at all sampling points. Sedimentation rates, sediment oxygen demand (SOD), and N-P release were measured at points A2 and B2 to validate the exchange between the water column and sediment layers (Fig. 4).

A 24 × 24 m grid was used to represent the topographical characteristics of the aquaculture site and the size of the aquaculture facilities. The number of fish farms calculated in the fish growth model is 8 in total, and the allocation of fish in each farm through their life stages is based on observations. Each farm is of uniform size, and feed is supplied twice a day in accordance with actual farming practices. Individual numbers and wet weights for each year of fish life at the start time of farming are input as initial values into the fish growth model. Inputs and harvests are configured to occur in real-time in the model, and the individual weights and production per cage over time are used for model validation. The initial and boundary conditions for the ecological model simulating water quality and sediment were spatially input based on observed data from December 2018, after interpolation. The horizontal grid size is the same as in the hydrodynamic model. The water column consists of 5 sigma layers and the depth variation due to tides is reflected for using the results of the hydrodynamic model. As detailed observations for the sediment layer were not available in this study, three layers were constructed. The first layer is known as the oxygen penetration depth at 0.1 cm, the second layer corresponds to the observed depth of 2 cm, and the third layer is set at 8 cm. The calculation period is approximately 360 days from 1 January 2019. The calculation interval is set to 20 seconds for stable calculations (Fig. 5, Table 1).
| Item | Detailed | ||
|---|---|---|---|
| Fish-growth model | Fish species | Mullet | |
| Number of fish farm (ea) | Total | 8 | |
| 0-year | 1 | ||
| 1-year | 5 | ||
| 2-year | 2 | ||
| Fish farm size (m3/ea) | 24 m × 24 m × 5 m | ||
| Feed input amount (kg/year) | Total | 3,245,100 | |
| 0-year (kg/year/farm) | 307,200 | ||
| 1-year (kg/year/farm) | 256,560 | ||
| 2-year (kg/year/farm) | 827,550 | ||
| Feed input and stocking time (day) | 0-year | 120, 120 | |
| 1-year | 85, 0 | ||
| 2-year | 59, 0 | ||
| Feed input frequency | Twice a day | ||
| Stocking number (ea) | Total | 540,000 | |
| 0-year (ea/farm) | 900,000 | ||
| 1-year (ea/farm) | 260,000 | ||
| 2-year (ea/farm) | 247,500 | ||
| Initial wet-weight (g/ind.) | 0-year | 5 | |
| 1-year | 105 | ||
| 2-year | 300 | ||
| Ecological model (water-quality and sediment) | Initial condition | Input after interpolation of data observed in December 2018 | |
| Boundary condition | |||
| Horizontal grid size | 24 m × 24 m | ||
| Number of vertical layers in water | 5 layers | ||
| Number of vertical layers in sediment | 3 layers | ||
| Depth data | Numerical map + Topographic map + Precise topographic map around fish farm | ||
| Flow field | Result of hydrodynamic model (Jung et al., 2020) | ||
| Common | Calculation period (day) | 360 (2019-year) | |
| Timestep (sec) | 20 | ||
Research on mullet (Mugil cephalus) is scarce, so parameters were entered based on observations or through a calibration process. Where observational data were available, preference was given to using them. If the calculated values obtained using literature values did not match well with observational data, coefficients were adjusted based on the observational data. In cases where new equations were created or there were no references to quote, values were obtained through a model calibration process (Table 2).
| Parameter | Description | Value | Unit | Source |
|---|---|---|---|---|
| FCR | Feed carbon content | 43.31 | % | Measured |
| FWR | Feed moisture content | 14 | % | Measured |
| AQCR | Fish carbon content | 54.7 | % | Measured |
| AQWR | Fish moisture content | 67.3 | % | Measured |
| Rd | Digestibility rate | 85 | % | Cromey et al. (2002) |
| EO2 | Energy consumption per 1 g of oxygen consumed by respiration | 14.3 | J/mg O2 | Hepher (1988) |
| K0 | O2 consumption per fish weight and day | 0.00069 | g O2/g fish/day | Claireaux & Lagardère (1999) |
| nbr | Weight exponent for basal metabolism | 1.0 | - | Ursin (1967) |
| RCJ | Coefficient convert carbon to Jule | 48.8 | J/mg C | Ren et al. (2012) |
| RCalJ | Coefficient convert calory to Jule | 4.187 | J/cal | Parsons et al. (2013) |
| Cd | Drag coefficient | 0.015 | - | Webb (1975) |
| CSDA | Energy intake rate | 9–26 | % | Jobling (1981) |
| Dtp | Temperature adjustment parameter | 4.93 | - | Hernández et al. (2003) with calibration |
| tm | Maximum lethal temperature | 32.9 | °C | |
| αt | Temperature function parameter | –0.086 | /°C | |
| βt | –0.15 | /°C | ||
| RON | N/O ratio for excretion of fish | 0.06 | g N/g O | Person-Le Ruyet et al. (2004) |
| RNP | P/N ratio for excretion of fish | 0.05 | g P/g N | Lupatsch & Kissil (1998) |
| Itime | Ingestion time | 300 | sec | Calibrated |
| SlopeOxygenLim | Slope coefficient according to DO limit | 2 | /(mg/L) | Rensel et al. (2013) |
| KOxygenLim | DO concentration value at which the DO limit occurs | 4 | mg/L | |
| aL | Coefficient 1 for calculating fish length | 2.4 | - | Wassef & Shehata (1991) with measured data |
| bL | Coefficient 2 for calculating fish length | 3.3 | - | |
| Fmin | Minimum temperature impact coefficient | 1.7 | - | Calibrated |
| aSV | Coefficient 1 for calculating the stomach volume | 7.3 | - | Gosch et al. (2009) with calibration |
| aSV | Coefficient 2 for calculating the stomach volume | 10–6 | - | |
| Fmax | maximum temperature impact coefficient | 0.5 | - | Calibrated |
| Topt1 | Minimum optimal temperature | 4.0 | °C | Calibrated |
| Topt2 | Maximum optimal temperature | 30.0 | °C | Calibrated |
| Tmin | Minimum limit temperature | 2.0 | °C | Calibrated |
| Tmax | Maximum limit temperature | 27.0 | °C | Calibrated |
| Fdomin | Minimum DO concentration impact coefficient | 0.35 | - | Calibrated |
| Fdomax | Maximum DO concentration impact coefficient | 0.0 | - | Calibrated |
| DOopt1 | Minimum optimal DO concentration | 6.0 | mg/L | Calibrated |
| DOopt2 | Maximum optimal DO concentration | 6.0 | mg/L | Calibrated |
| DOmin | Minimum limit DO concentration | 2.6 | mg/L | Calibrated |
| DOmax | Maximum limit DO concentration | 11.0 | mg/L | Calibrated |
| a | Coefficient 1 for calculating fish area | 2.4 | - | O’Shea et al. (2006) with calibration |
| b | Coefficient 2 for calculating fish area | 3.3 | - | |
| Rden_growth_A | Growth limit coefficient A according to stocking density | 1.0 | - | Calibrated |
| Rden_growth_B | Growth limit coefficient B according to stocking density | 3.0 | - | Calibrated |
| Rden_growth_C | Growth limit coefficient C according to stocking density | 30.0 | - | Calibrated |
| Rden_growth_D | Growth limit coefficient D according to stocking density | 5.0 | - | Calibrated |
| Rden_growth_E | Growth limit coefficient E according to stocking density | 0.2 | - | Calibrated |
| Rden_death_A | Death coefficient A according to stocking density | 1.0 | - | Calibrated |
| Rden_death_B | Death coefficient B according to stocking density | 3.0 | - | Calibrated |
| Rden_death_C | Death coefficient C according to stocking density | 50.0 | - | Calibrated |
| Rden_death_D | Death coefficient D according to stocking density | 0.0 | - | Calibrated |
| Rden_death_E | Death coefficient E according to stocking density | 1.8 | - | Calibrated |
Each scenario, based on the calibrated and validated model, was conducted by altering farming methods such as feed input, stocking density, number of cages, and farm locations. The aim was to derive management plans related to changes in fish production and sediment environment based on them. The target sediment environmental criterion in this study is TOC 20 mg/g. The scenarios constructed in this study are presented in Table 3.
Scenario 1 involved varying only the stocking density among the farming conditions, Scenario 2 entailed changing only the feed input, and Scenario 3 encompassed variations in both stocking density and feed input. The magnitude of changes for each scenario was +25%, −25%, −50%, and −75%, uniformly adjusted regardless of the life stage.
Scenario 4 involves the case where the optimal feed amount is supplied. It is assumed that by supplying the maximum amount of feed that the fish can ingestion, minimizing wasted feed, maximizing fish growth, both economic benefits and environmental improvements can be achieved simultaneously. Therefore, in this study, it was intended to supply only the amount of feed that the fish can maximum ingestion, defined as the optimal feed input. The optimal feed input was calculated and applied for each life stage.
Scenario 5 analyzes the appropriate management plans among reducing the number of cages, stocking density, and feed input. Since the farming conditions vary for each life stage, and the number of farms is not constant (Table 1), it is impossible to directly compare the effect of reducing in feeding density and feed input on a 1:1 basis in the existing farming method. Therefore, scenario 5 were first conducted uniformly, such as farming only specific life stage, labeled as 5-1 (0-year), 5-2 (1-year), 5-3 (2-year), while keeping the total number of cages consistent with the existing farming method at 8 cages. Based on this, a reduction scenario was implemented. For example, the scenario involving a decrease in the number of cages to 6 represents a 25% reduction from the total of 8 cages. When compared to the scenario in which both stocking density and feed input are reduced by 25%, the total stocking amount and feed input amount remain the same, but the stocking density is higher.
Result and Discussion
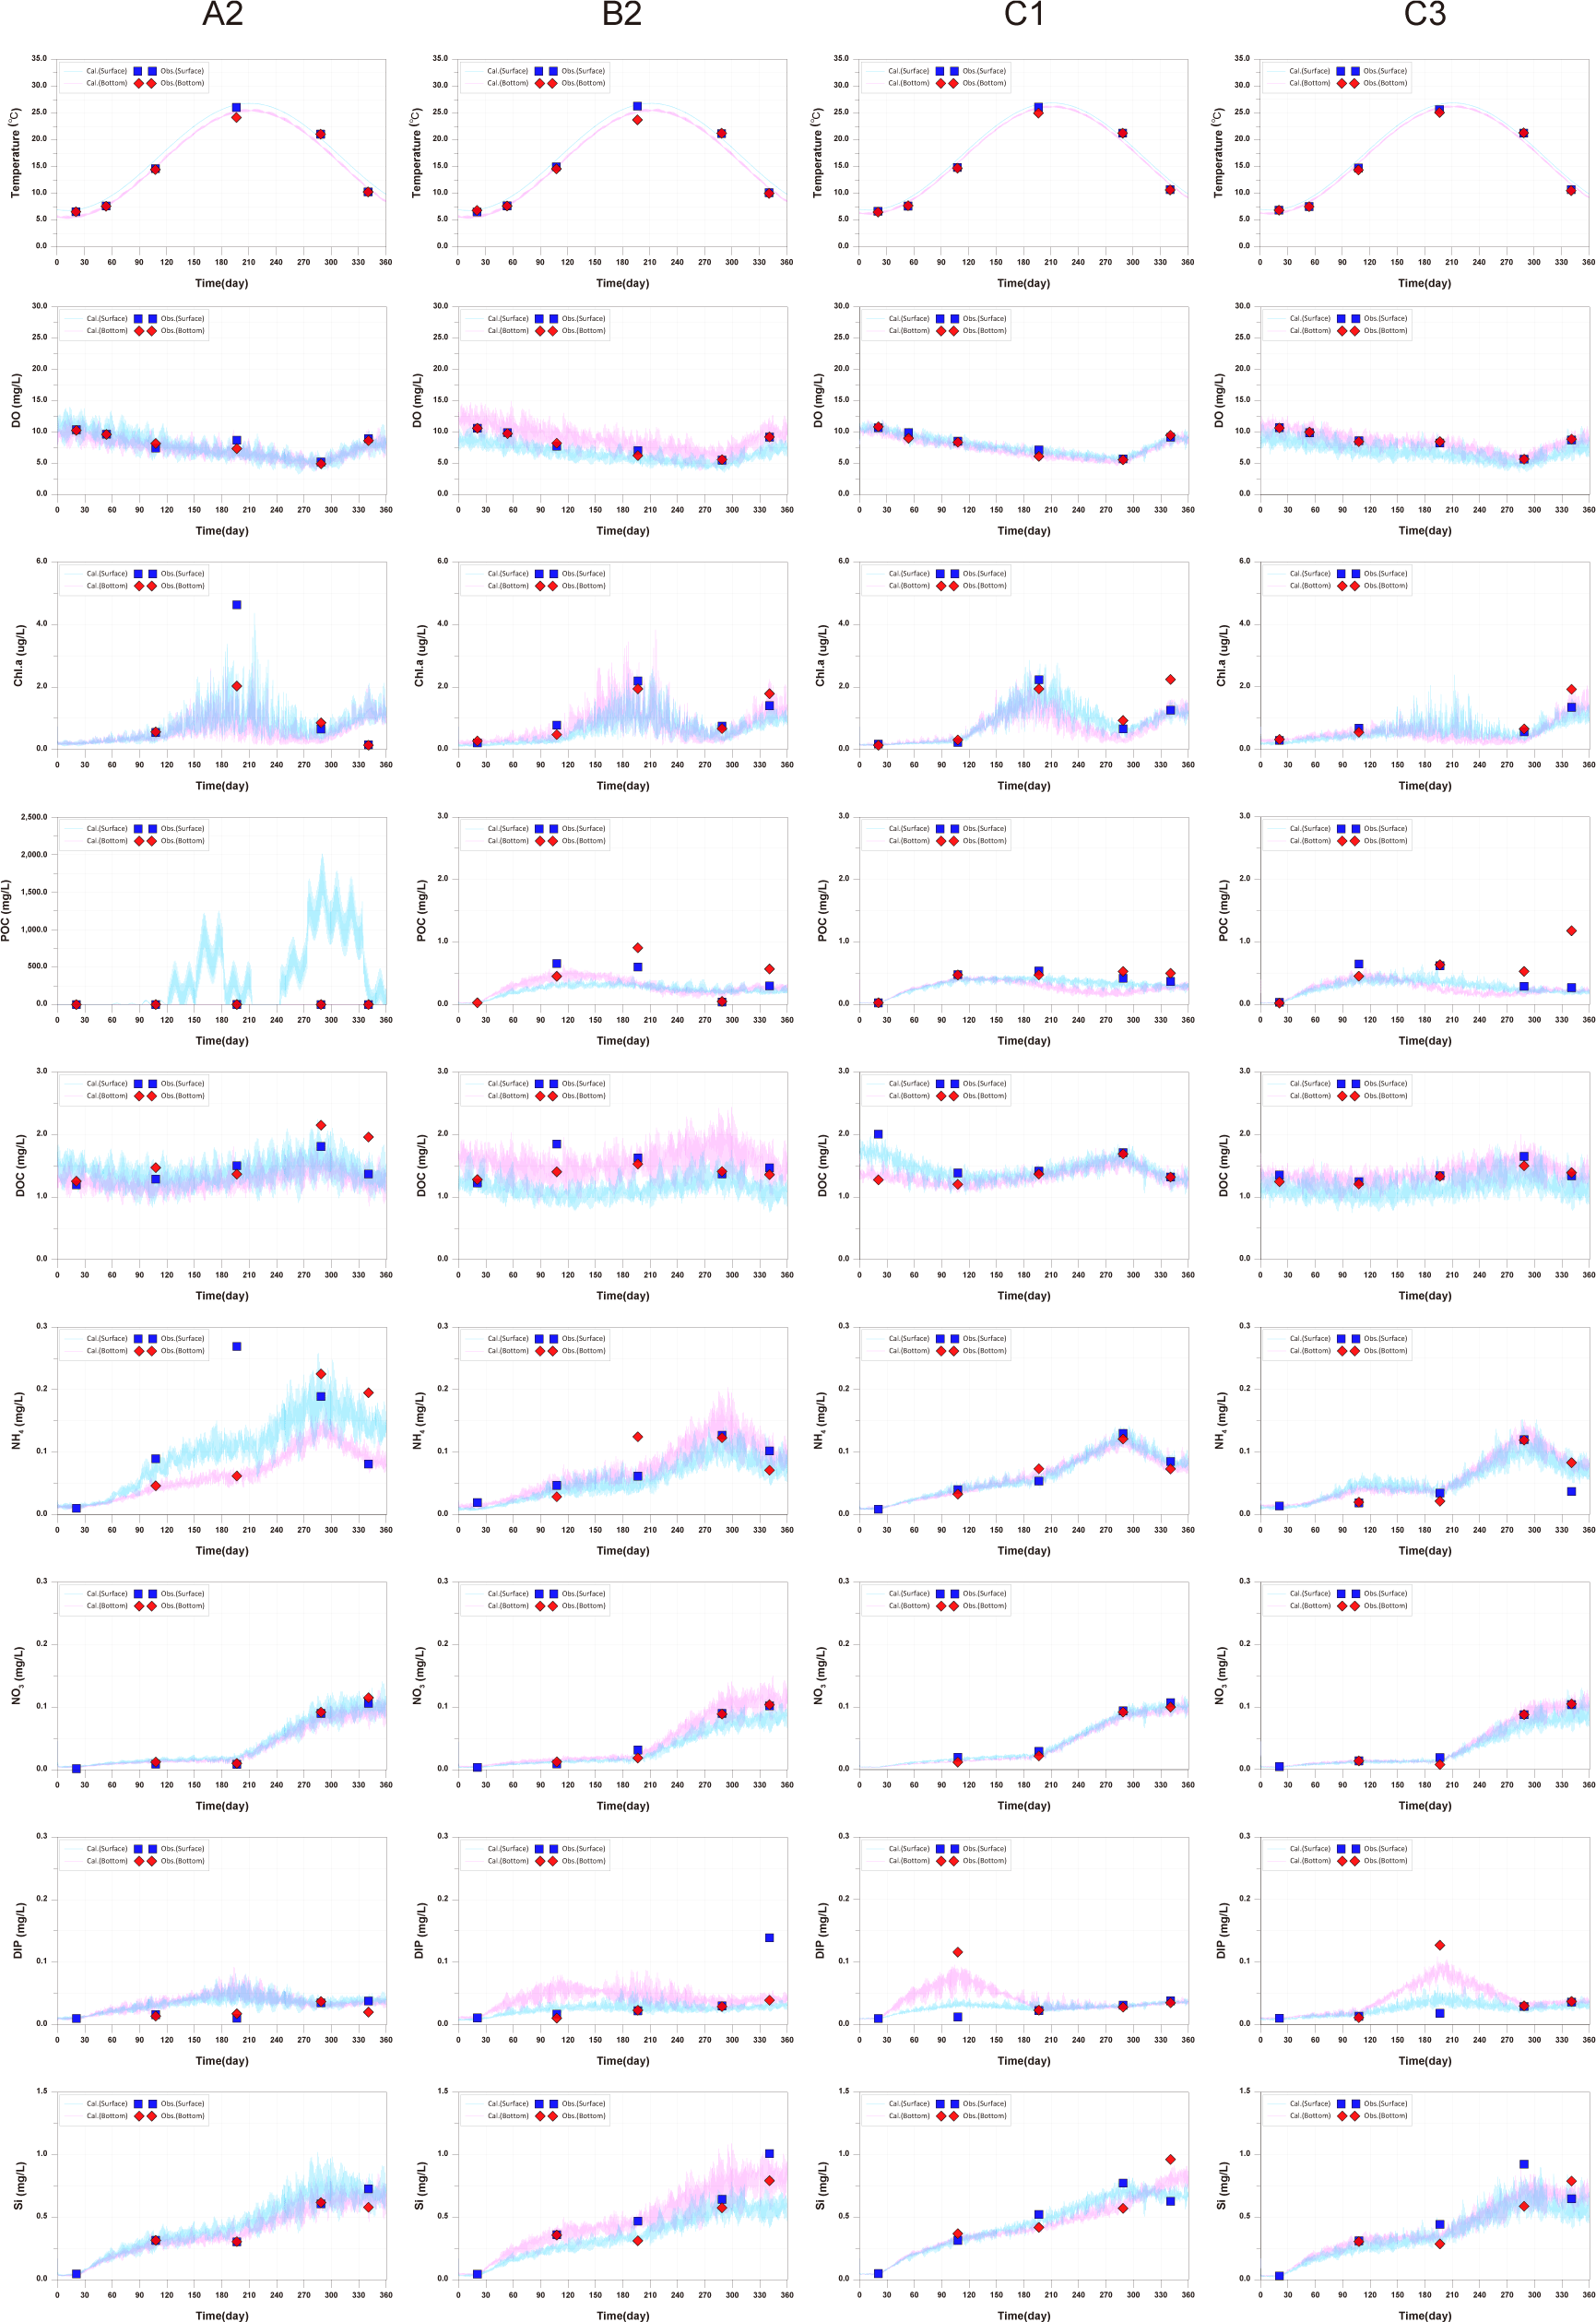
For DO, a decreasing trend in concentration during the summer was well reproduced, consistent across all observed sites. This is due to the increase in water temperature such as the decrease in reaeration, decomposition of increased organic matter, increased fish respiration, and the increase in Chl.a. Chl.a showed an increase in concentration during the summer followed by a decrease, then an increase during the winter (around day 345). The observational data showed a similar trend, but at point A2, there was a decrease around day 345, which the model could not reproduce. Additionally, the maximum observed values at the surface of A2 were about 5 ug/L during the summer, calculated values were lower than the observed values. The calculated values at the surface of B2 were lower than the observed values, attributed to nitrogen limitation. Although there were some instances of low reproducibility, overall, the model reproduced well. For POC, the reproducibility was relatively low, and the calculated values were lower than the observed values at all sampling points. In particular, at A2, the observed values appear significantly high, which is attributed to the influence of feed in the fish farm. This aspect could not be accurately reflected as the observations were conducted right next to the fish farm. Additionally, terrestrial loads were excluded due to lack of terrestrial load data in this model. As a result, POC concentrations could be calculated lower, and the insufficient supply of nutrients could be a cause of the limited phytoplankton growth. Furthermore, it is difficult to reproduce the different trends in the observed values at sampling points. DOC generally showed good reproducibility, but there was a significant error at point B2. Ammonium (NH4), the calculated values at the surface of A2 at the summer were lower than the observed values. However, the surface of A2, where the fish farms are located, exhibited the highest concentration, reflecting the impact of fish excretion. Nitrate (NO3) showed good agreement between observed and calculated values. Good reproducibility was achieved for dissolved inorganic phosphorus (DIP), with the exception of the lower layers at A2 (day 180) and B2 (day 345). Despite A2 having the highest P supply, the observed values were generally lower compared to other points. Si showed good reproducibility.
In this study, due to the scarcity of data for water quality assessment, there are limitations in evaluating the model’s reproducibility and interpreting the observed values. This suggests the need to increase the frequency of observations in future studies (Fig. 6).
The observed values for B1, B2, B3, C1, C2, and C3 showed minimal changes over time and the calculated values showed similar trends. The points A1, A2, A3, where the aquaculture facility is located, had higher TOC concentrations compared to other points, and the concentrations changed with the operating conditions of the aquaculture facility. Specifically, at A2 and A3 points, near the location of the 2-year-old fish pen, TOC concentrations started to increase from day 59, corresponding to the initiation of feed input for the 2-year-old fish (Fig. 7). The model results also reflected these trends. However spatial distribution differences were observed at A1, A2, A3 points compared to the observed values (Fig. 8). In actuality, the aquaculture facility arranges the fish by age within 12 × 12 m cages. However, due to the 24 × 24 m grid configuration in this study, the spatial distribution of fish by age was not accurately represented. This discrepancy resulted in spatial concentration differences. Improving this aspect could enhance the model’s reproducibility of temporal and spatial distributions of observed values.
The presented sedimentation rate of POC is the combined result of sedimentation of plankton, POC, wasted feed, and fish feces. It showed excellent reproducibility at the A2 station, with significantly higher sedimentation observed compared to the B2 station. This is attributed to the occurrence of wasted feed and fish feces associated with fish farming. For SOD, A2 station showed good reproduction after the feed supply (day 59), while B2 station showed calculated values lower than observed values. A concentration change is observed around day 60. This is attributed to the uniform input of initial values due to the lack of observational data for sediment layer DO. Release-DIN (RDIN) at the A2 station showed calculated values lower than observed values, while Release-DIP (RDIP) showed calculated values higher than observed values. The results at A2, located inside the farm area, were significantly higher than those at B2, located outside the farm area, in both observed and calculated values. The lack of substance cycling in the early stages for both RDIN and RDIP suggests that the initial setting of DIN and DIP in the sediment layer is the cause, similar to SOD. This emphasizes the need for detailed observations of sediment layer parameters (Fig. 9).
While the sedimentation rates were well reproduced, there is a need for quantitative data on the sedimentation of specific materials such as wasted feed, fish feces, and other particulate matter in the actual field. This is crucial because the model scenario results for management plans may vary depending on the quantity and characteristics of each sedimenting material. In the current model results, it is observed that at A2 station, fish feces are sedimenting the most, while at B2 station, wasted feed is the predominant sedimenting material (Fig. 10). This variation is attributed to the differences in sinking rates of each material.

Various studies have been conducted on the sinking rates of fish feces and feed particles. The sinking rates of fish feces have been reported in a range from 0.5 cm/s to 9.2 cm/s (Chen et al., 2003; Cromey et al., 2002; Magill et al., 2006). For example, Cromey et al. (2002) reported a sinking rate of 3.2 cm/s for the feces of Atlantic salmon weighing 3.39 kg. Chen et al. (2003) reported sinking rates ranging from 3.7 to 9.2 cm/s for Atlantic salmon feces weighing between 0.6 and 1.7 kg. Magill et al. (2006) studied sinking rates of gilthead sea bream and sea bass and reported sinking rates of approximately 0.5 cm/s and 0.7 cm/s, respectively, for fish weighing between 50−280 g and 60−380 g. In the absence of direct observations on sinking rates in the study area, values were derived based on literature values through a calibration and validation process (0.7815 cm/s). The sinking rates of feed particles vary widely, ranging from 3.9 cm/s to 15.0 cm/s (Cromey et al., 2002). However, the feed used in this study area is floating feed, and the sinking rate is expected to be lower compared to the previously mentioned feeds. Therefore, the sinking rate measured through indoor experiments was employed. The measured sinking rate of the feed was 0.18 cm/s, which appeared smaller than values reported in other studies. In Fig. 10, the results indicate that wasted feed settles over a relatively broad range, with smaller values at station A2 compared to fish feces, and larger values at station B2. This is because the sinking rate of the feed used in the study area is lower than that of fish feces. According to Go et al. (2022), who conducted isotopic analysis on sediment layers observed at B1−B3, fish feces predominantly contributed with 55.9% of the organic material in the sediment layer. Although a quantitative comparison with the model results is not be feasible, these findings are consistent with each other fish feces levels are higher in proximity to fish farm sites.
For the 0-year-olds, both individual growth and production per cage were significantly higher compared to the observed values. In the case of the 1-year-olds, individual growth and production per cage were well reproduced, but production per cage did not match well after approximately day 270. For the 2-year-olds, all aspects were well reproduced, and a trend of production per cage decreasing and then increasing, which was not observed in the 0-year-olds and 1-year-olds, was well reproduced. Previous studies on fish growth models, such as Brigolin et al. (2014) and Burić et al. (2020), report the coefficient of determination (R²) as a standard metric for model validation. The R2 for individual growth was 0.9037 for 0-year-olds, 0.8349 for 1-year-olds, and 0.9852 for 2-year-olds. The R2 values for production per cage were 0.9589 for 0-year-olds, 0.9275 for 1-year-olds, and 0.6387 for 2-year-olds (Fig. 11).
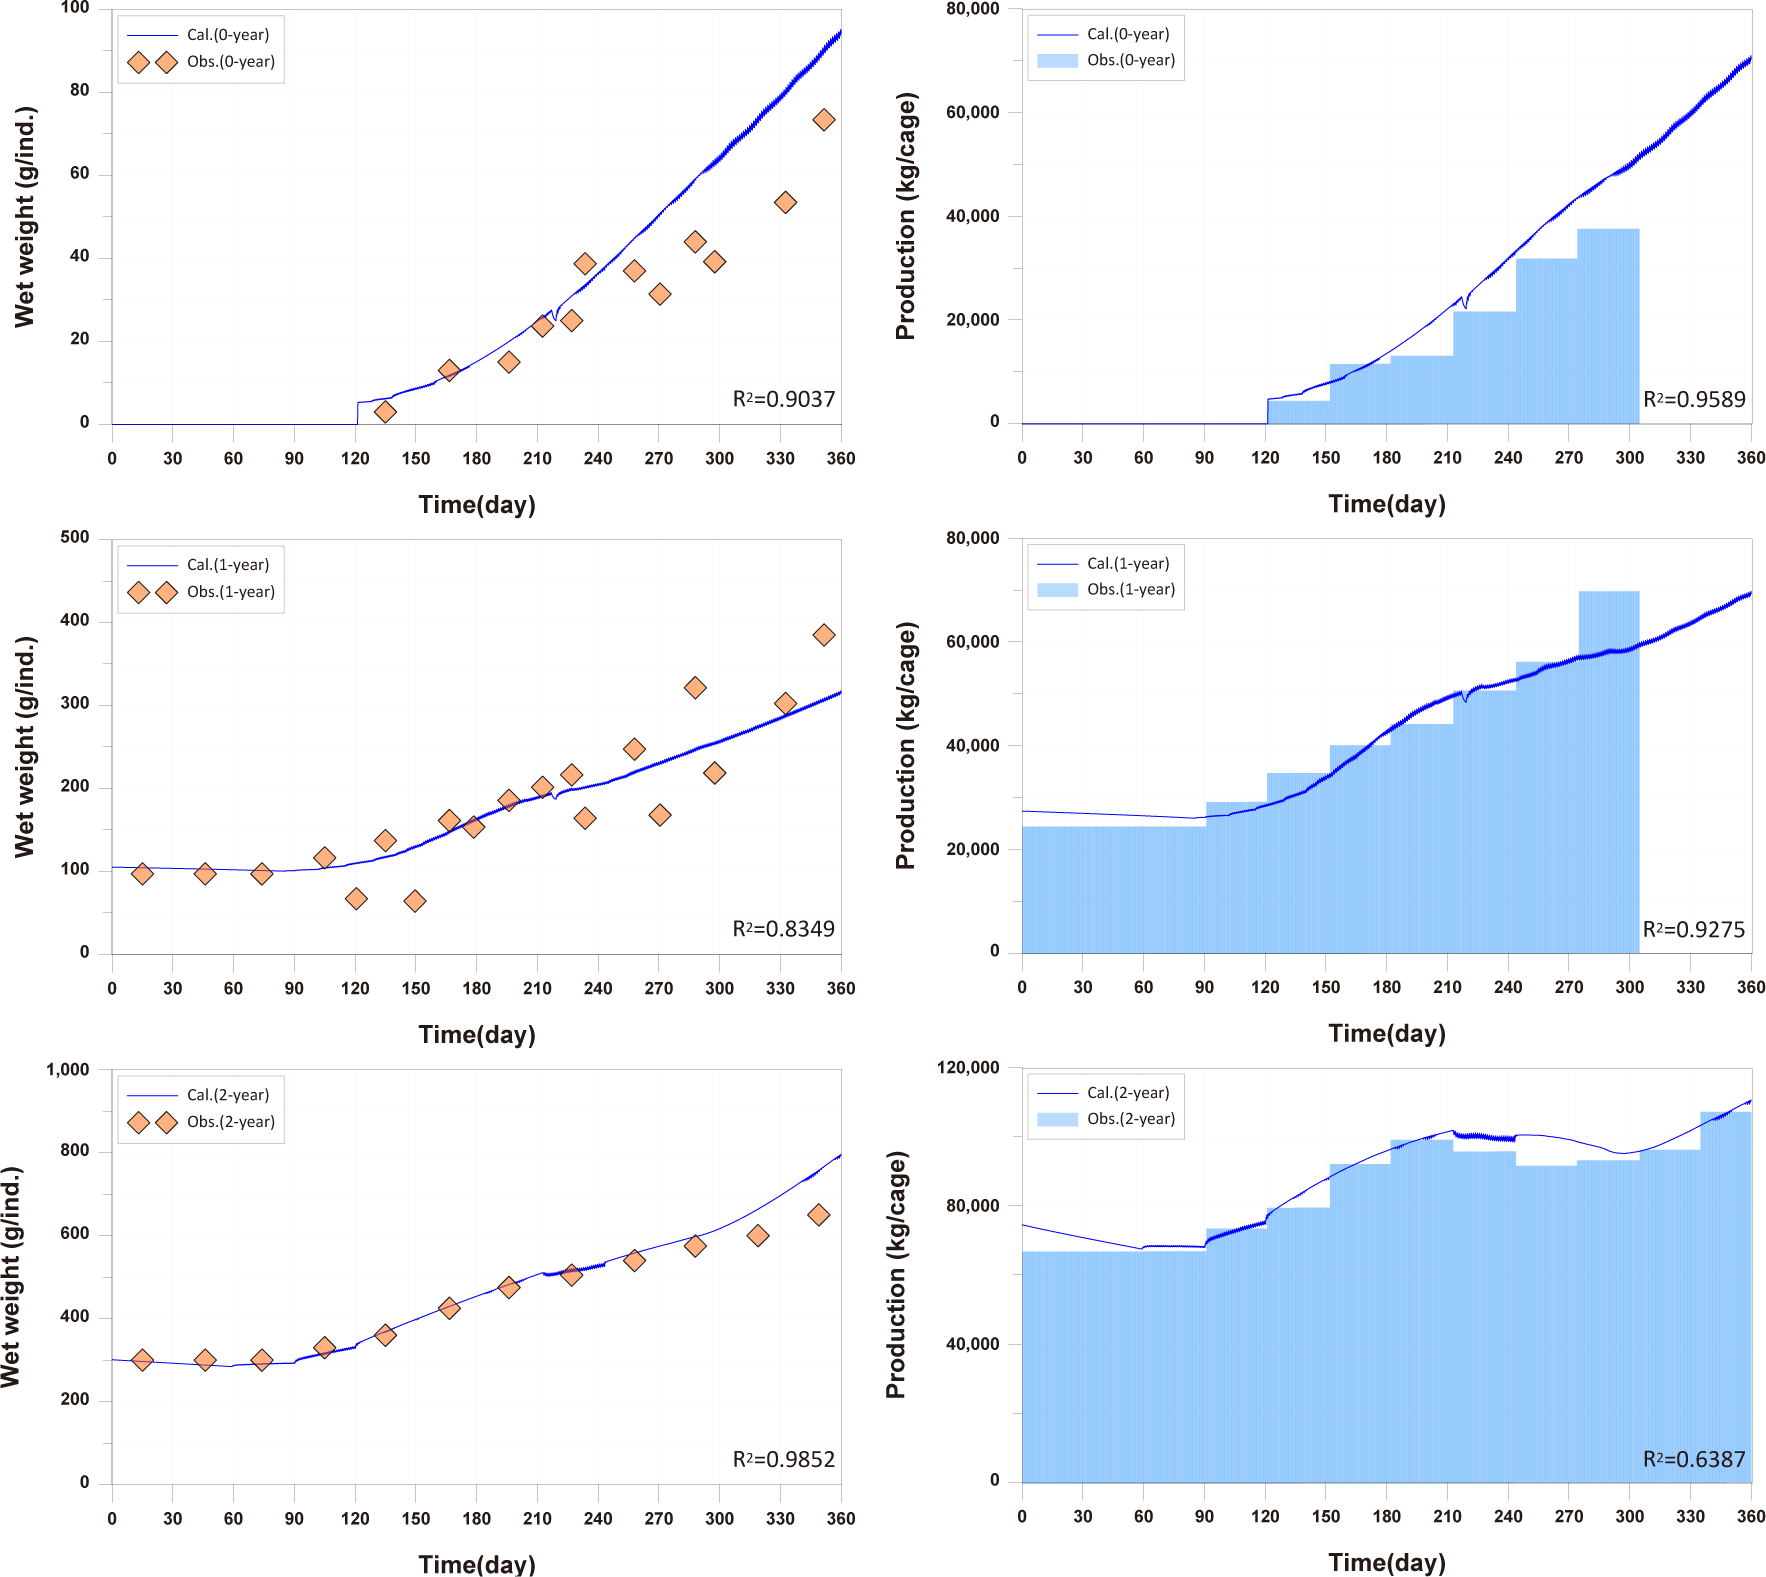
Studies such as Brigolin et al. (2014) and Ferreira et al. (2012) have focused on individual fish growth in existing fish growth models and have not tested fish production per cage. In the study by Burić et al. (2020), fish mortality was considered to calculate fish production. However, production validation was not conducted, and the fish mortality rate was input based on fish weight without considering environmental conditions. Fish production is considered a primary factor influencing the aquaculture environment, leading to the generation of pollutants. Therefore, production validation is essential.
When fish are exposed to stressors such as water temperature and DO levels, this can lead to energy demands in excess of those required for growth and survival, resulting in growth retardation and mortality. While fish lived in their natural habitat can move to different environments in the face of rapid environmental change, farmed fish are exposed to abrupt changes in a confined space. High stocking density on the farm can increase competition among them for space and feed, potentially reducing growth. Stocking density directly affects fish growth, survival behavior, health, feed supply, and production, making it a critical factor in aquaculture (Rahman et al., 2005). High stocking density increases fish stress, leading to increased oxygen consumption irrespective of avoidance behavior (Portz et al., 2006). Turnbull et al. (2005) found that stocking densities above 22 kg/m3 in Atlantic salmon farms increased the likelihood of poorer welfare. In our study, stocking density exceeded 22 kg/m3 for 0-year-olds and 1-year-olds from approximately day 330 and for 2-year-olds from the early stages of farming (Fig. 12). Choi et al. (2008) suggested that high stocking density may contribute to mortality, as mortality rates in concentrated fish farms were 1.2 to 5.4 times higher than in farms with lower stocking densities. Stocking density is directly related to physiological and physical parameters such as water quality, capacity, nutrition, and the type of aquaculture system, making it a key factor in achieving optimal aquaculture production (Islam et al., 2006). Additionally, analyzing various stocking densities through modeling can determine the optimal feeding amount for maximizing benefits, promoting environmentally sustainable aquaculture that simultaneously preserves the ecosystem (Cubillo et al., 2016). Therefore, in this study, we conducted fish model validation considering energy consumption and mortality processes based on DO concentration, water temperature, and fish stocking density.
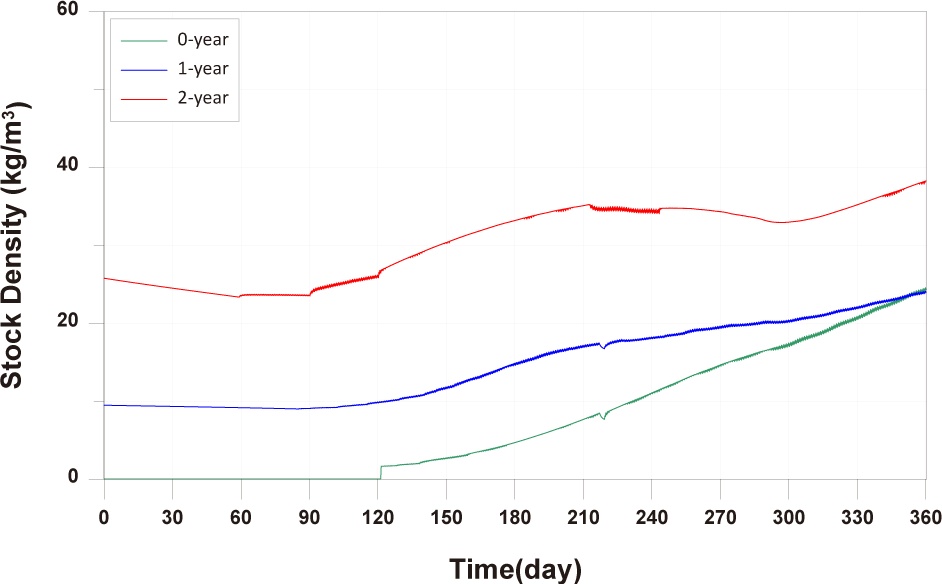
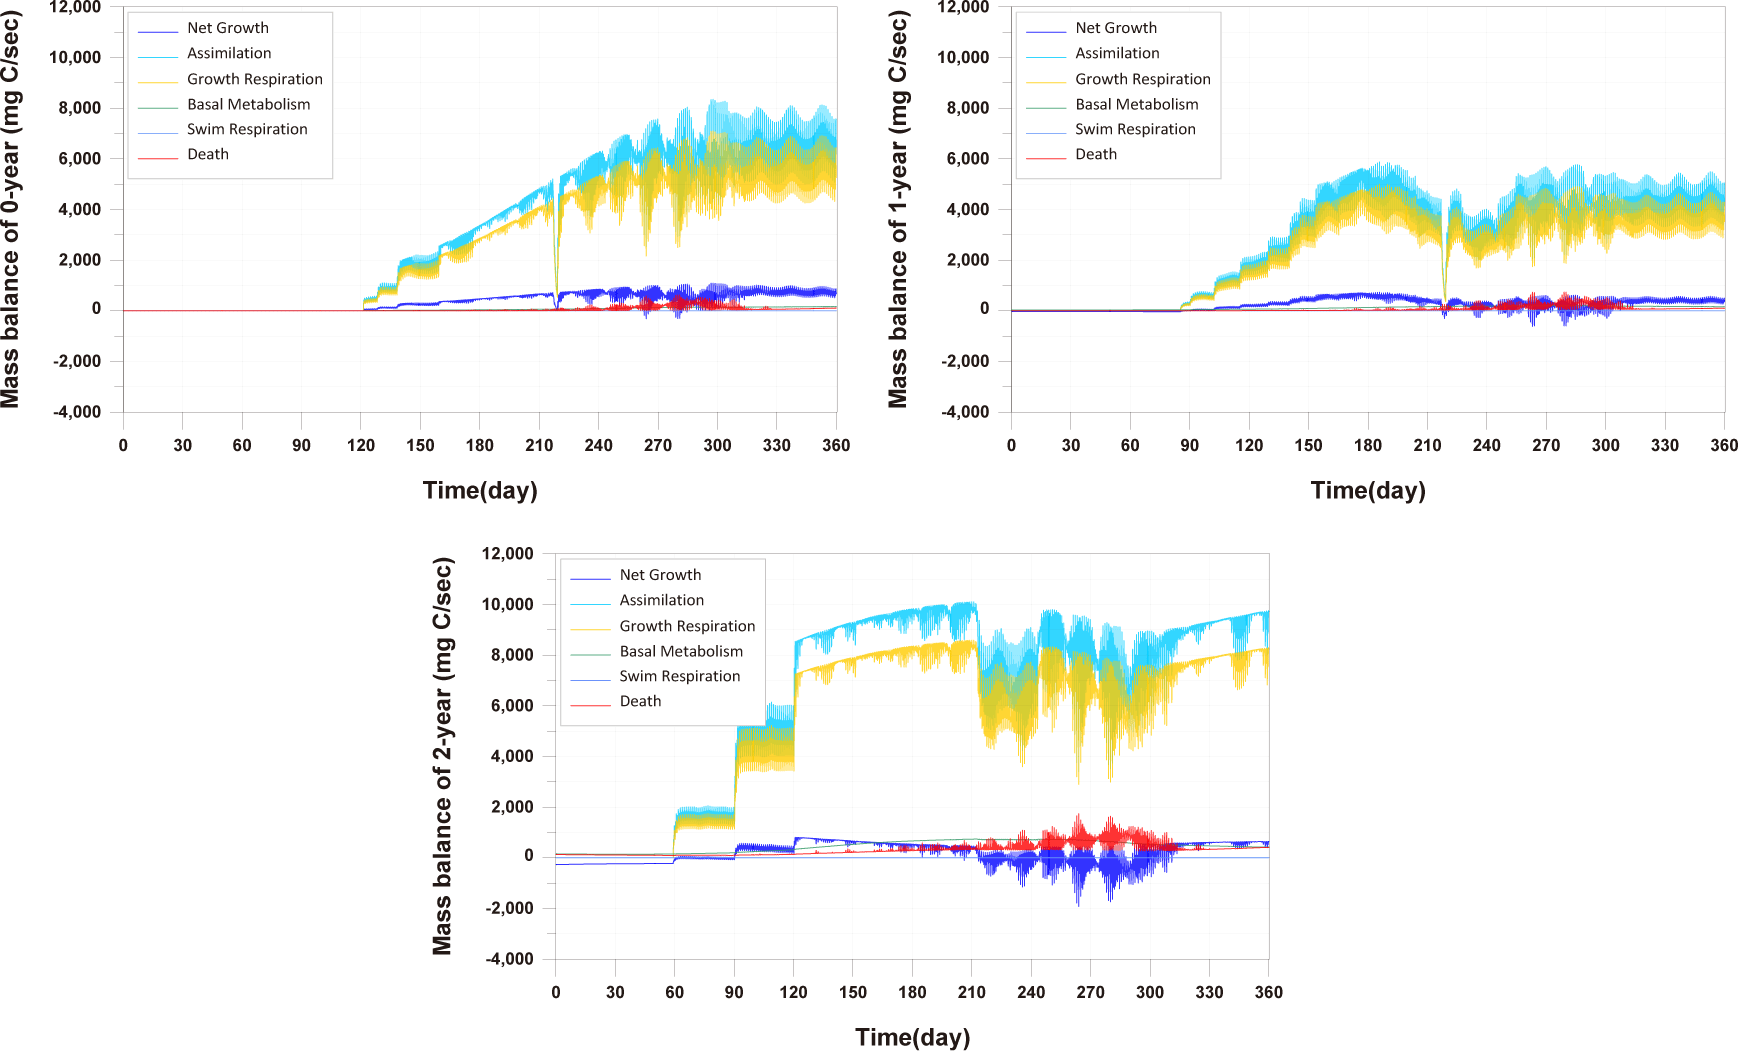
In comparing the production levels of 0-year-olds, 1-year-olds, and 2-year-olds across different farms in the present study, it can be observed that only the production of 2-year-olds decreases before rebounding (Fig. 11). This decrease in 2-year-olds is attributed to an increase in mortality and respiration rates, resulting in a negative net growth (Fig. 13). Specifically, the stocking density of 2-year-olds is notably higher than that of 0-year-olds and 1-year-olds from the feeding initiation stage (Fig. 12). Since environmental factors, excluding stocking density such as water temperature, salinity, DO, etc., show minimal variation, the primary reason for the increased mortality in 2-year-olds is presumed to be the impact of stocking density.
In this study, fish mortality due to environmental factors was considered through field data and model validation processes. Although there is a lack of data to validate the model, this study is the first attempt to consider fish mortality based on environmental conditions.
The sedimentation characteristics of fish feed and feces required as input data for the model can vary depending on the size of the fish, the composition of the feed components, and the physical properties of the seawater. It is expected that particles in fish feces will be smaller when the fish is smaller (Magill et al., 2006), and the sinking rate will increase as the particle size increases (Cromey et al., 2002). However, in this study, the sinking rate based on particle size was not considered, and a constant value was used as input.
According to Stigebrandt (1999), the discharge of ammonia and phosphates is proportional to the protein content of the feed, so taking into account the protein content is crucial for accurately predicting the impact on fish farms. The research on fish growth modeling considering carbohydrate, protein, and fat content has been conducted by Brigolin et al. (2014) and Stigebrandt (1999). However, in this study, observations related to these factors were not conducted and thus were not considered.
The target species of this study, the mullet (Mugil cephalus), is known as a preferred aquaculture species due to its ability to withstand sudden changes in salinity. Chang et al. (2001) conducted experiments on the survival rate of mullet in response to abrupt changes from freshwater to seawater or from seawater to freshwater. The results indicated that mullet could survive freshwater for a period of time. Since there were no rapid salinity changes in this area leading to death, death due to salinity was not considered.
In this study, information regarding the fish cage aquaculture facility was obtained through on-site observations and data provided by fishermen. Actual data on cage layout and age distribution of fish could be observed. However, data on fish production, individual weights, mortality rates and feed use were mostly obtained from the fishermen, which may lead to inaccuracies. Additionally, actual measurements of physiological processes in fish are needed. Currently, research on mullet is limited, so use of results from other fish species or corrections parameters made by calibration and validation. Data collection is underway at a sea bream aquaculture facility implementing the Smart Farm system, where information about the fish cages is automatically stored. Future modeling efforts will utilize this data.
Before implementing Scenarios 1 to 3, the feed input and fish ingestion were analysed for each life stage when farming was conducted using the existing farming method (Fig. 14). The amount of wasted feed is calculated by subtracting the fish ingestion from the feed input. The generation of wasted feed is a factor that not only wastes feed costs but also degrades the sediment environment. There is almost no occurrence of wasted feed in 0-year-olds and 1-year-olds, while 2-year-olds exhibit a significant amount of wasted feed, indicating the need for wasted feed management.
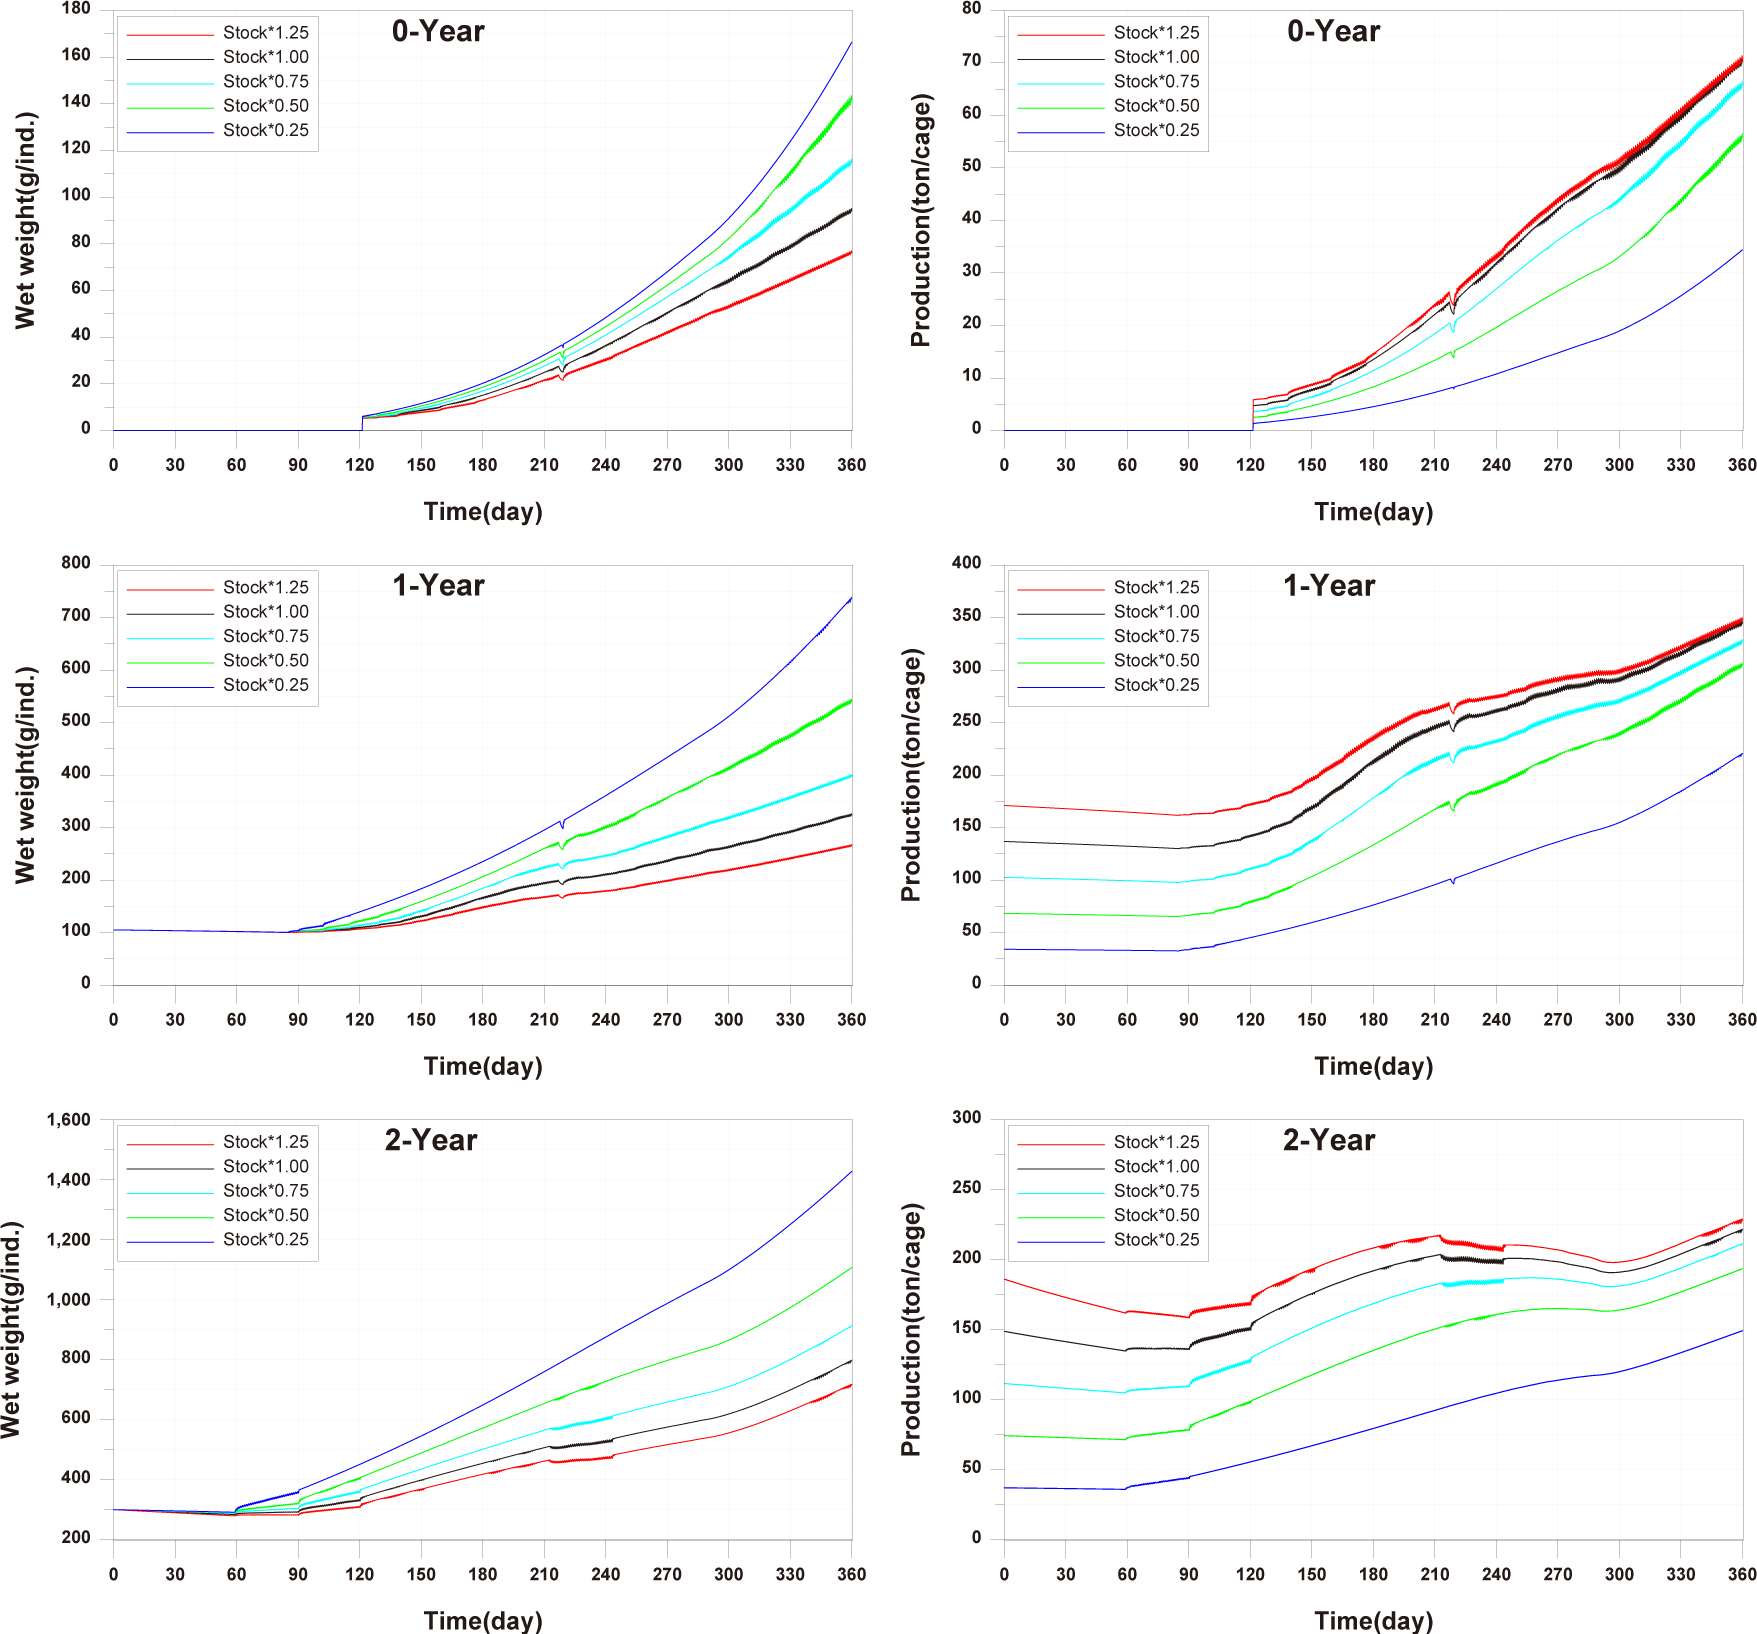
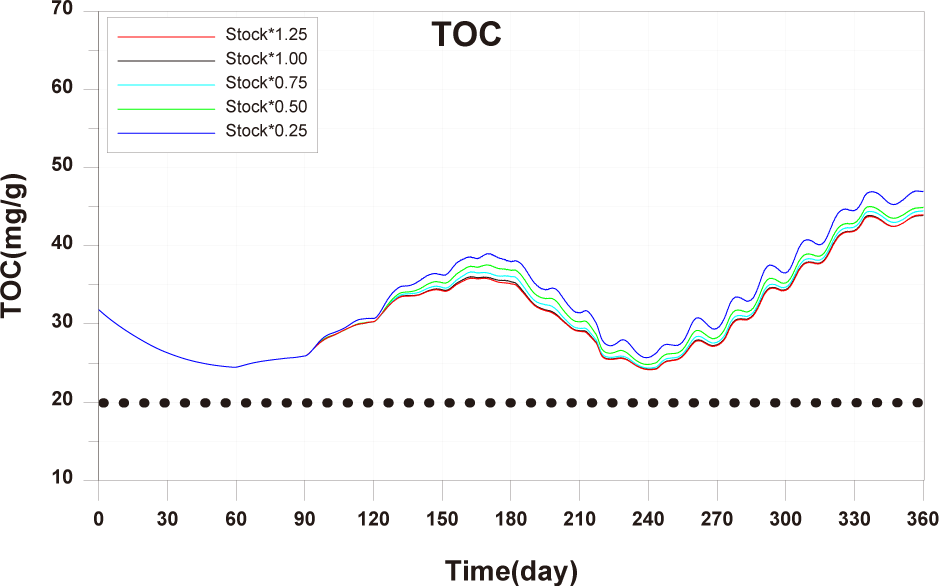
The results of Scenario 1 are shown in the Figs. 15−17. The occurrence of wasted feed significantly increased overall with the increase in feed input, but was found to be minimal for 1-year-olds, except for certain periods, indicating an insufficiency in feed supply from a productivity perspective (Fig. 15). Individual growth and production quantity appeared to increase with an increase in feed input and decrease with a reduction. However, in the case of 2-year-olds, increasing feed supply did not result in a significant difference in production compared to the existing farming method. This is attributed to an increase in stocking density due to increased individual growth, as discussed in 'Consider the death and respiration of fish impacted by temperature, dissolved oxygen (DO) and stocking density' section When reducing feed input led to a sharp decrease in individual growth and production quantity (Fig. 16). In the case of TOC in sediment, a significant improvement occurred when reducing feed input (Fig. 17). Consequently, it is evident that uniform feed input adjustment is not a method that satisfies both production and environmental aspects.

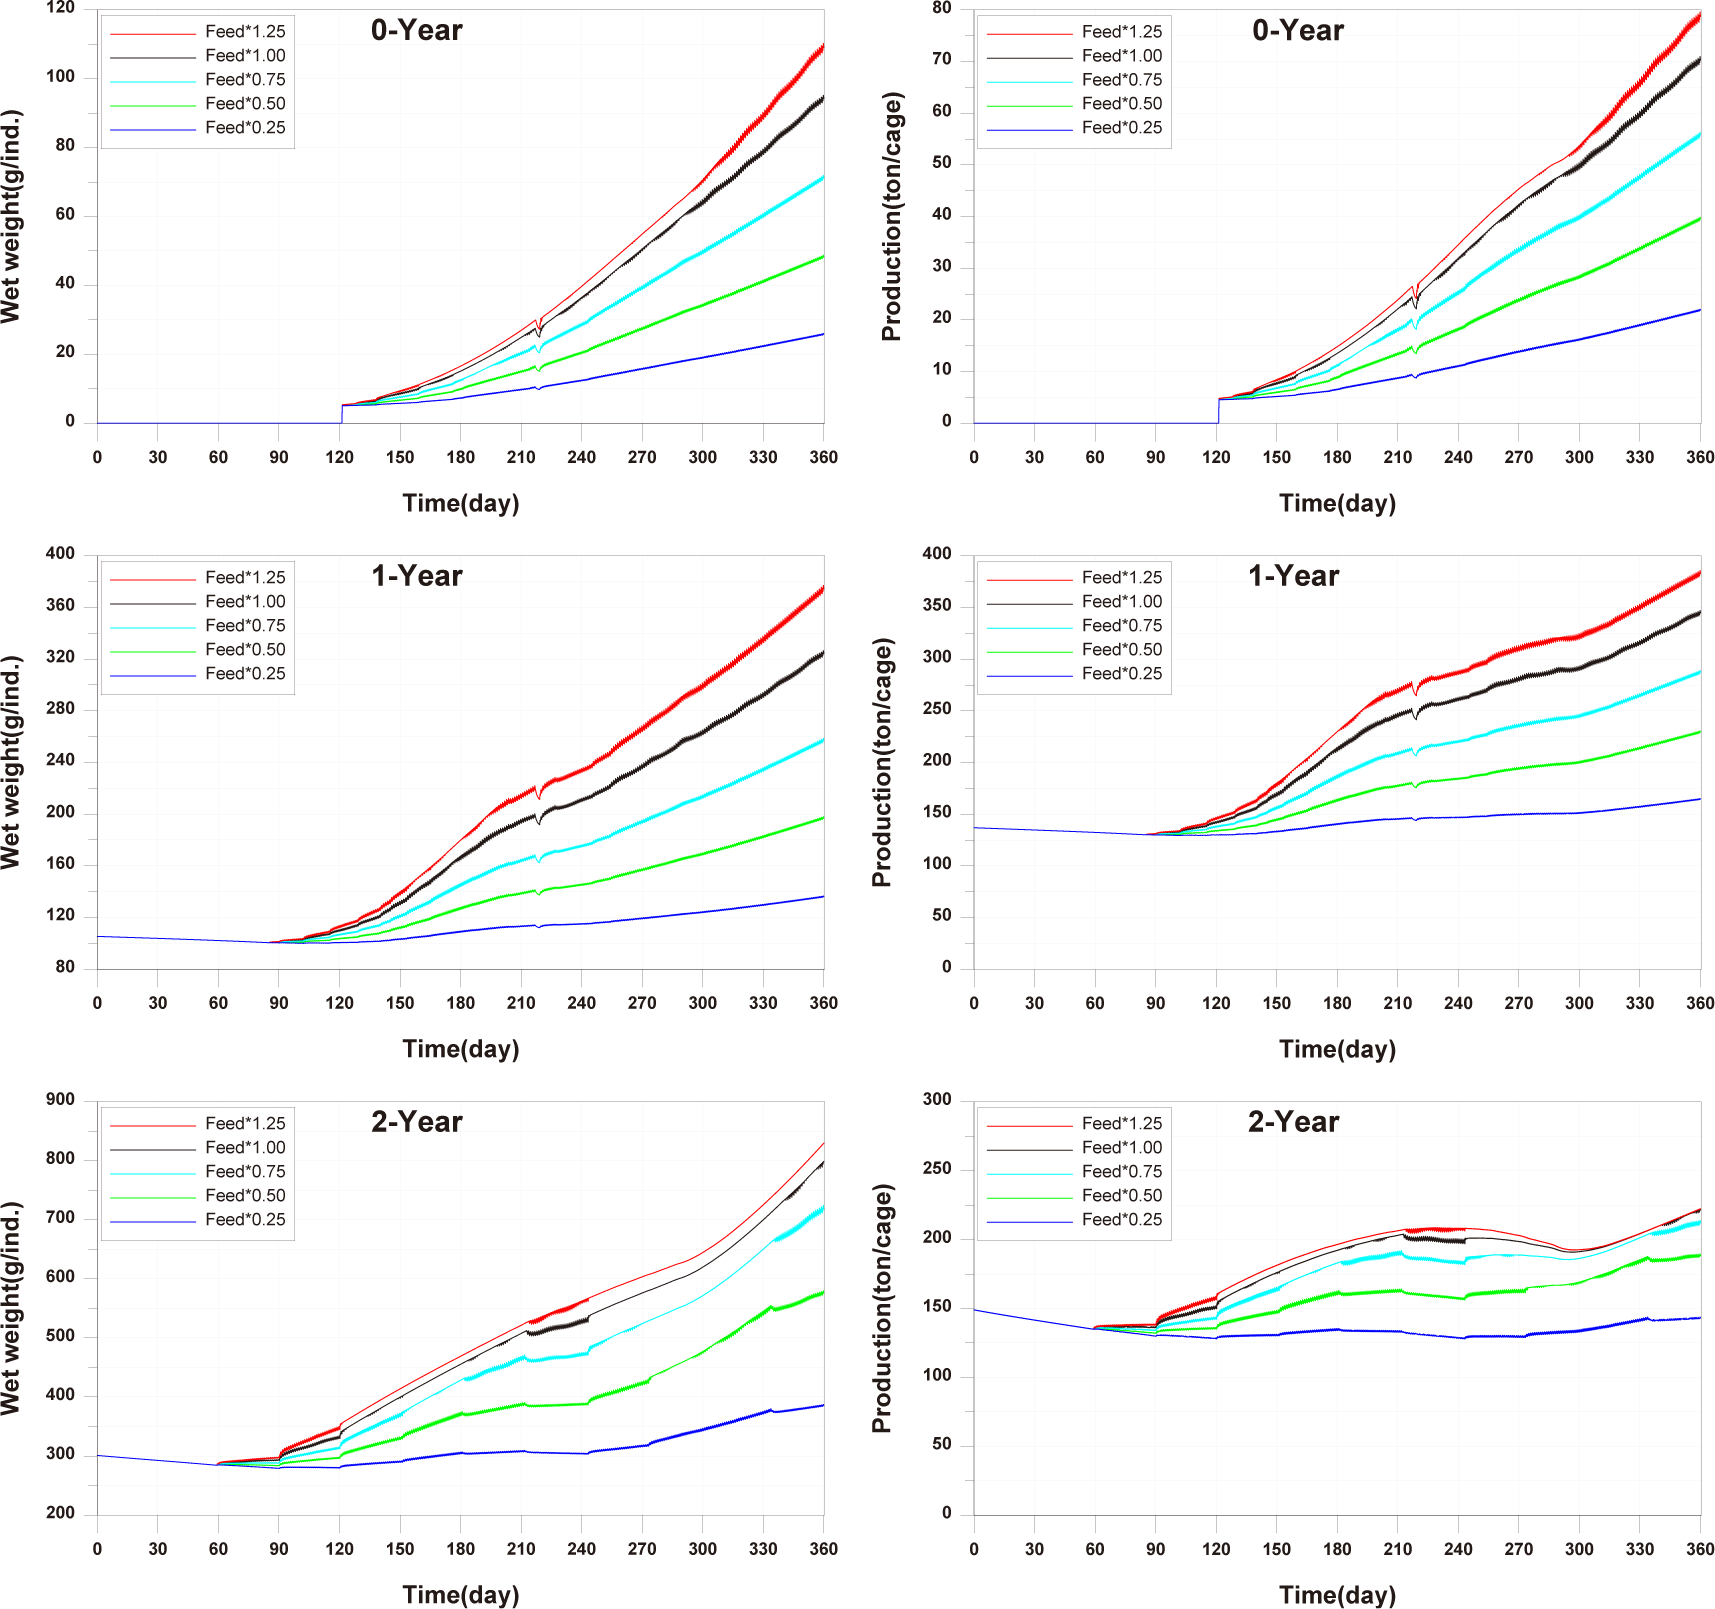
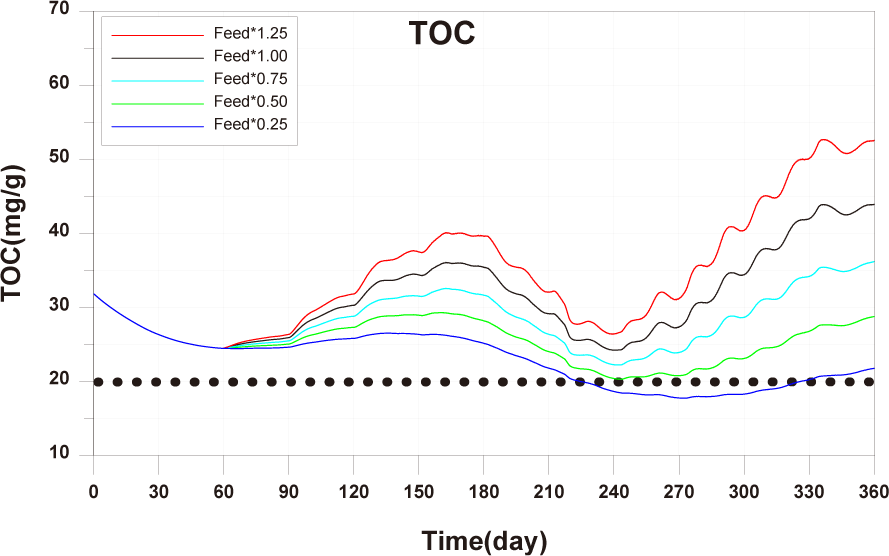
The results of scenario 2 are as shown in Figs. 18−20. The occurrence of wasted feed increased significantly with a decrease in stocking density. This was due to a reduction in fish ingestion (Fig. 18). Individual growth and production quantity showed an increase with a decrease in stocking density. It indicating that individual growth and productivity increased due to a decrease in fish respiration and mortality associated with increased stocking density. For 2-year-olds, increasing stocking density resulted in a decrease in growth rate, leading to little difference between stocking input and production quantity (Fig. 19). In the case of TOC in sediment, decreasing only the stocking density did not significantly alter the concentration. This is because although the amount of fish feces decreased with a decrease in fish production, the occurrence of wasted feed increased (Fig. 20). Ultimately, it is evident that while this approach can increase productivity, it fails to meet sediment environmental criteria.

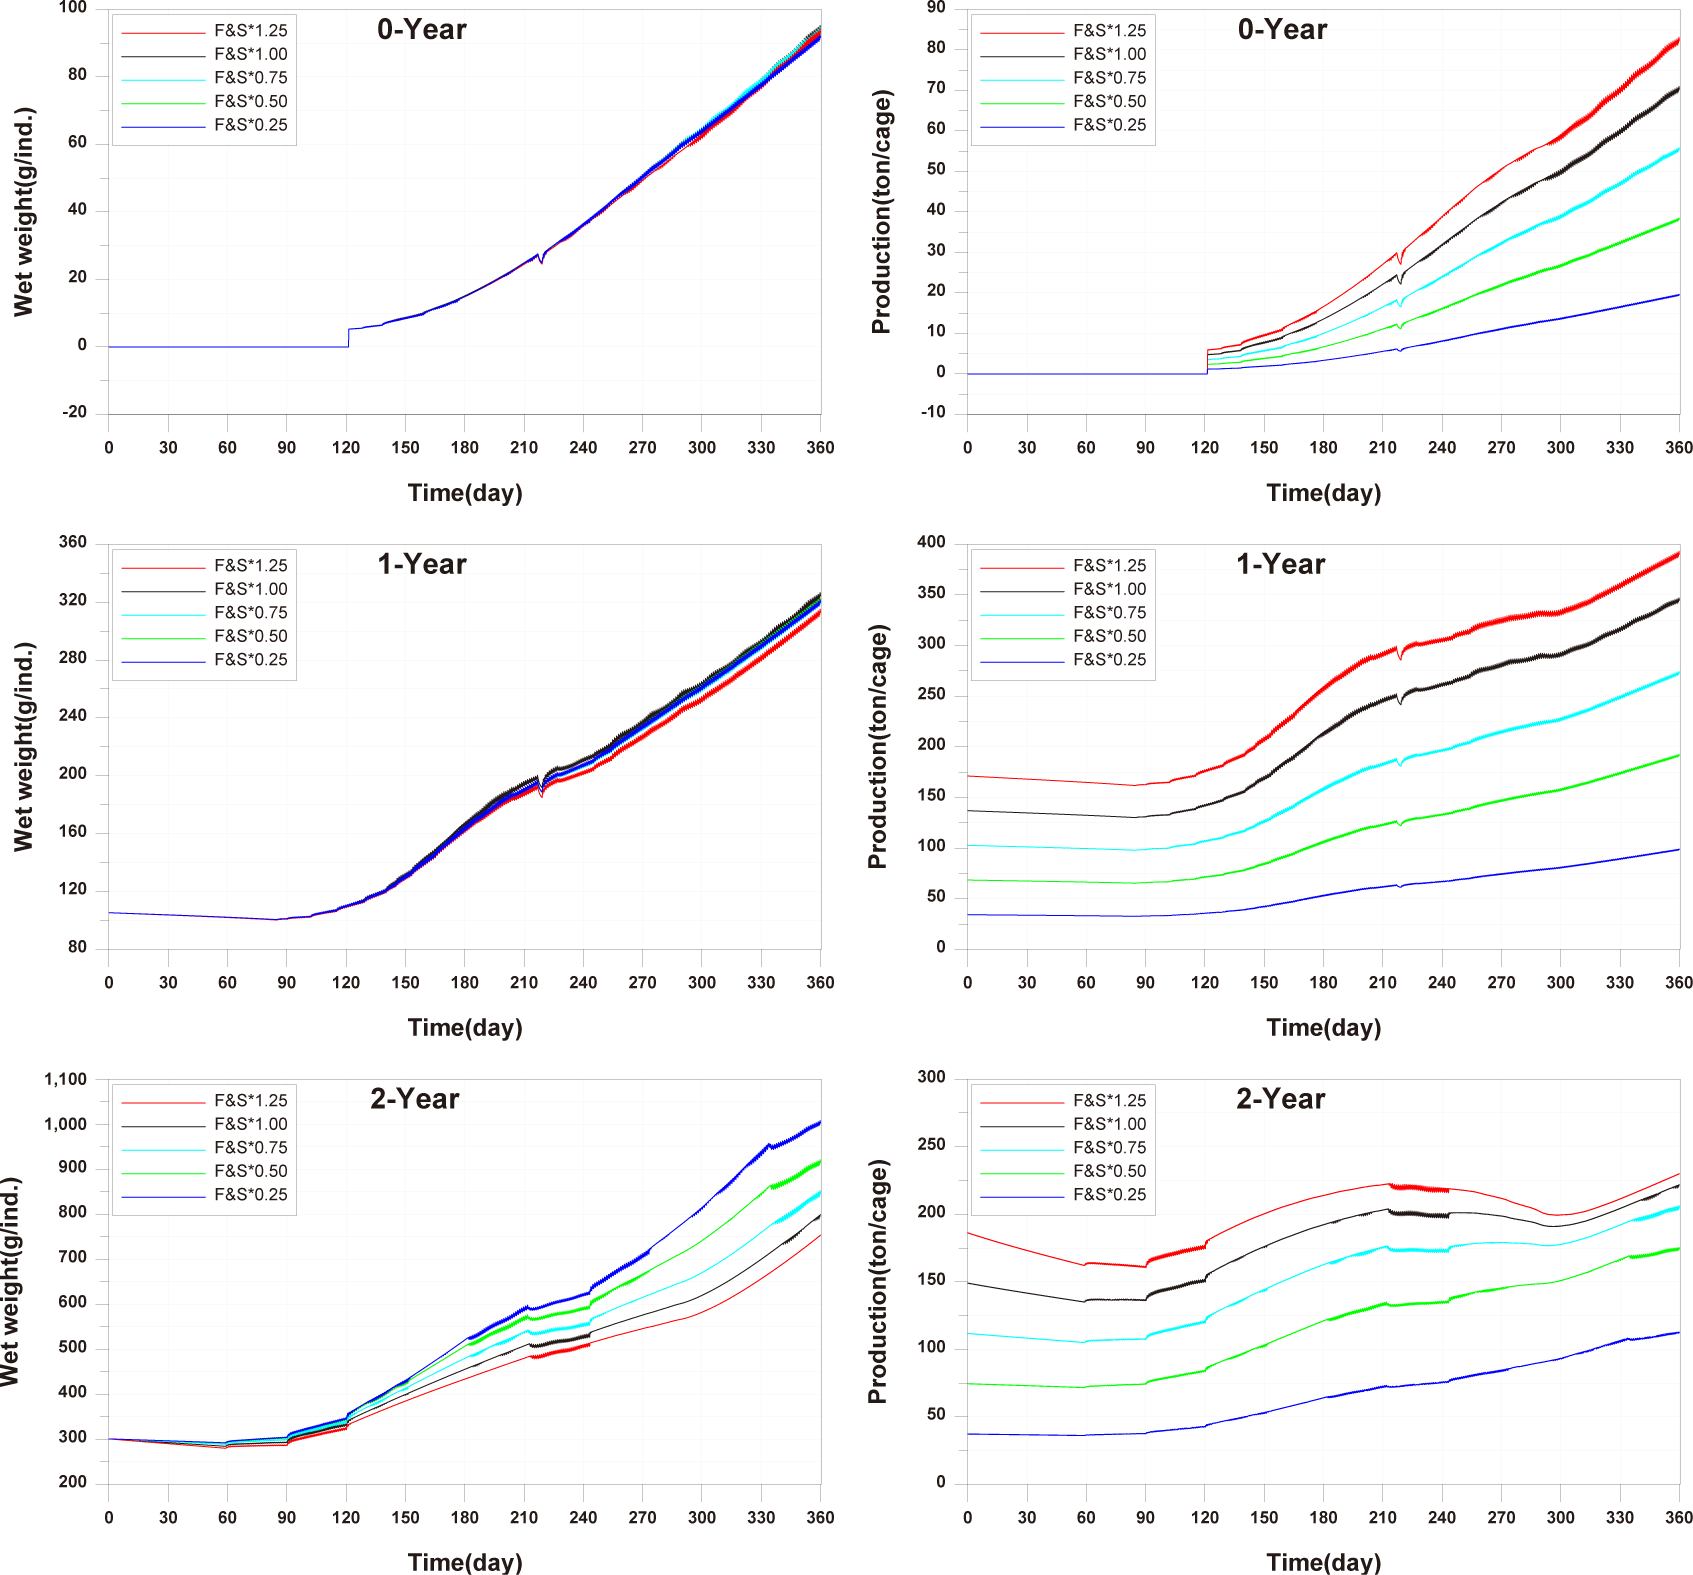
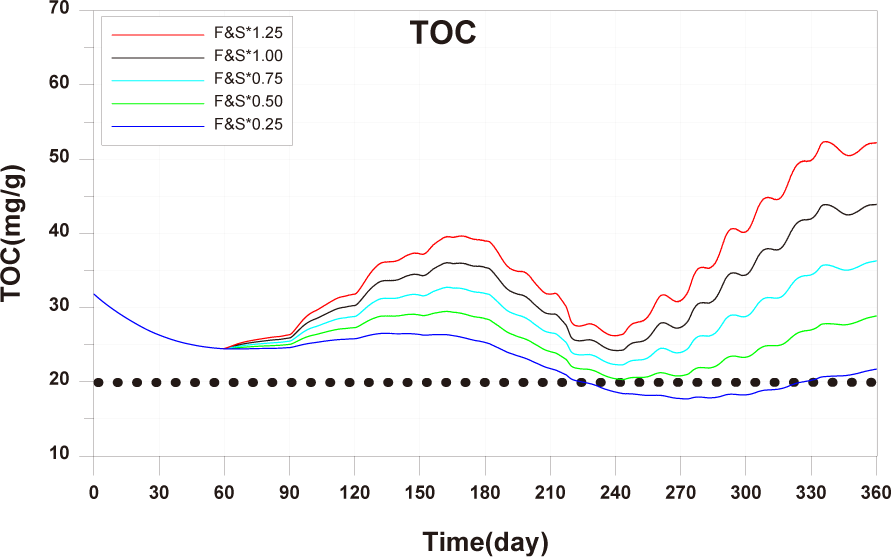
The results of Scenario 3 are shown in the Figs. 21−23. The occurrence of wasted feed was found to decrease with a reduction in both feed input and stocking density. This is attributed to an increase in individual growth of fish due to the decrease in stocking density, leading to an increased feed ingestion per individual (Fig. 21). Individual growth showed little difference, except for 2-year-olds, which showed a relatively large variation in growth due to their sensitivity to changes in stocking density. In terms of production quantity, it was lower compared to Scenario 2. This is because although the environmental conditions for fish growth improved, the reduction in feed input as a food source led to decreased productivity (Fig. 22). TOC in sediment showed significant improvement with a decrease in both feed input and stocking density (Fig. 23). Similar to ‘Scenarios 1 and 2’, it is evident that this method does not satisfy both production and environmental aspects. However, it appears to be a more suitable approach compared to Scenario 1, as it allows for an increase in individual fish growth while improving sediment environmental conditions.

Upon examining the results of Scenarios 1 to 3, it is evident that uniformly adjusting stocking density and feed input is a challenging approach to derive a solution satisfying both production and environmental aspects. Furthermore, since there are variations in wasted feed occurrence and growth rates across different age groups, it is deemed necessary to implement age-specific management plans.
From the results of scenarios 1 to 3, it is observed that in the case of 0-year-olds, only a small amount of wasted feed occurs, while for 1-year-olds, the feed input is insufficient from a fish growth perspective, and for 2-year-olds, there is an excessive supply of feed. These are because the feed supply either exceeds or falls short of the fish’s ingestion capacity.
The optimal feed input for 0-year-olds and 1-year-olds is determined to be the maximum amount that fish can ingest. For 2-year-olds, As shown in Fig. 14, since there is already a large amount of wasted feed, the optimal feed input for 2-year-old fish is the amount of feed ingested by 2-year-olds fish in the model in which the validation was conducted. The calculated optimal feed input for 0-year-olds, 1-year-olds and 2-years-olds is depicted in Fig. 24. The increase in wasted feed occurrence at the 0-year-olds and 1-year-olds compared to the existing method is attributed to the increased amount of feed settling in the fish farm, corresponding to the increased feed input.
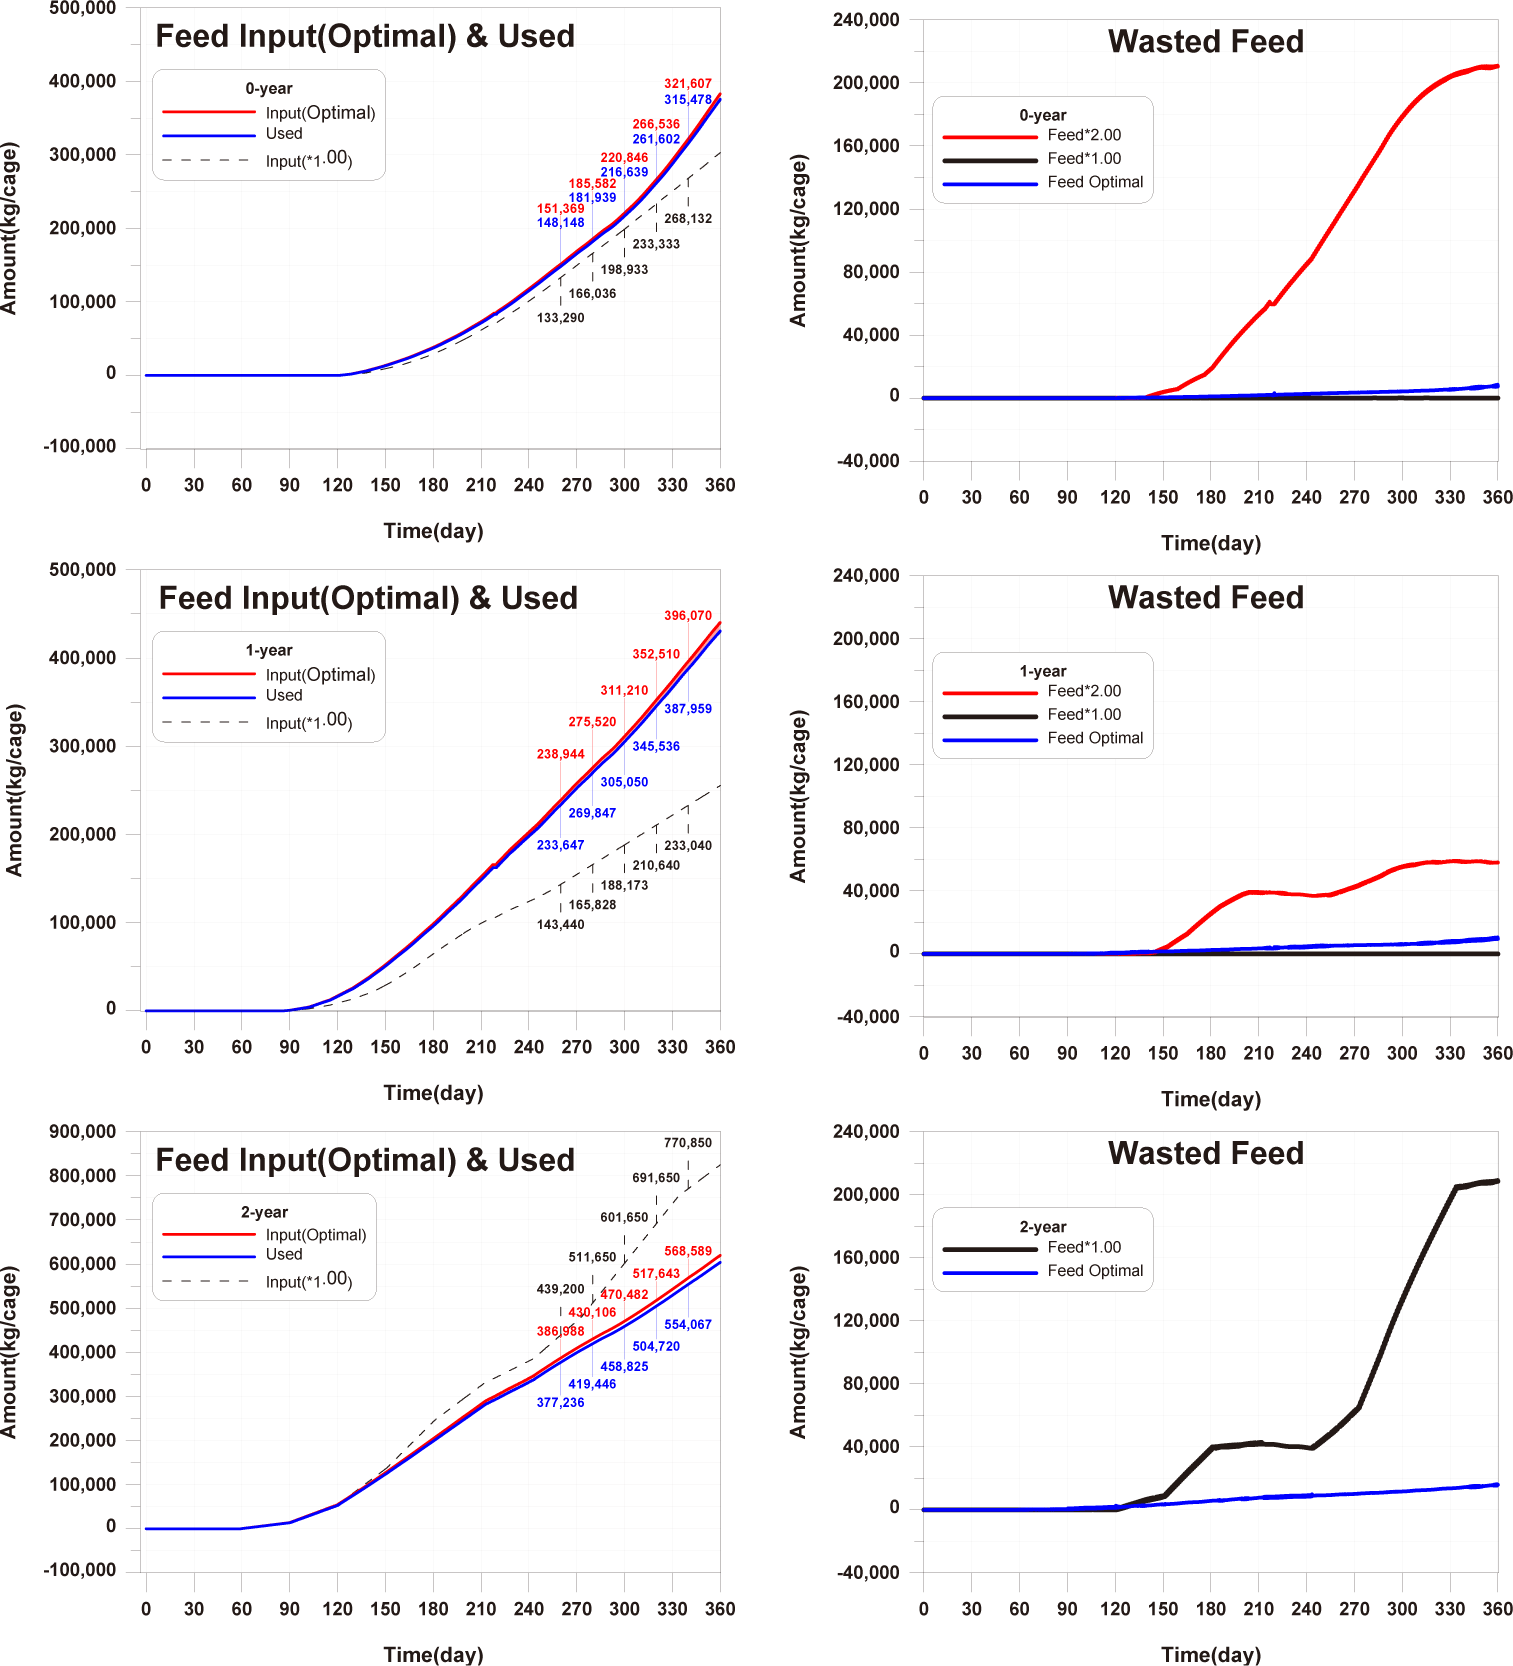
When optimal feed is supplied, the individual growth and production quantity of 0-year-olds and 1-year-olds increase, with a pronounced increase in the case of 1-year-olds (Fig. 25). However, in the case of sediment TOC, there was a deterioration compared to the existing method (Fig. 26). This is attributed to an increase in fish fecal production as fish production increased, despite little difference in the amount of wasted feed, as shown in Fig. 25. Nevertheless, the advantage of optimal feed input is evident in the shortened farming period required to achieve the same production quantity as the existing farming method for 0-year-olds and 1-year-olds. Particularly for 1-year-olds, individual growth remains similar with the existing method up to around day 270, and production quantity equals the existing method before day 240. Therefore, harvesting all 1-year-olds at this time allows for maintaining the same production quantity while gaining time to address the rapid deterioration of sediment conditions after day 240.
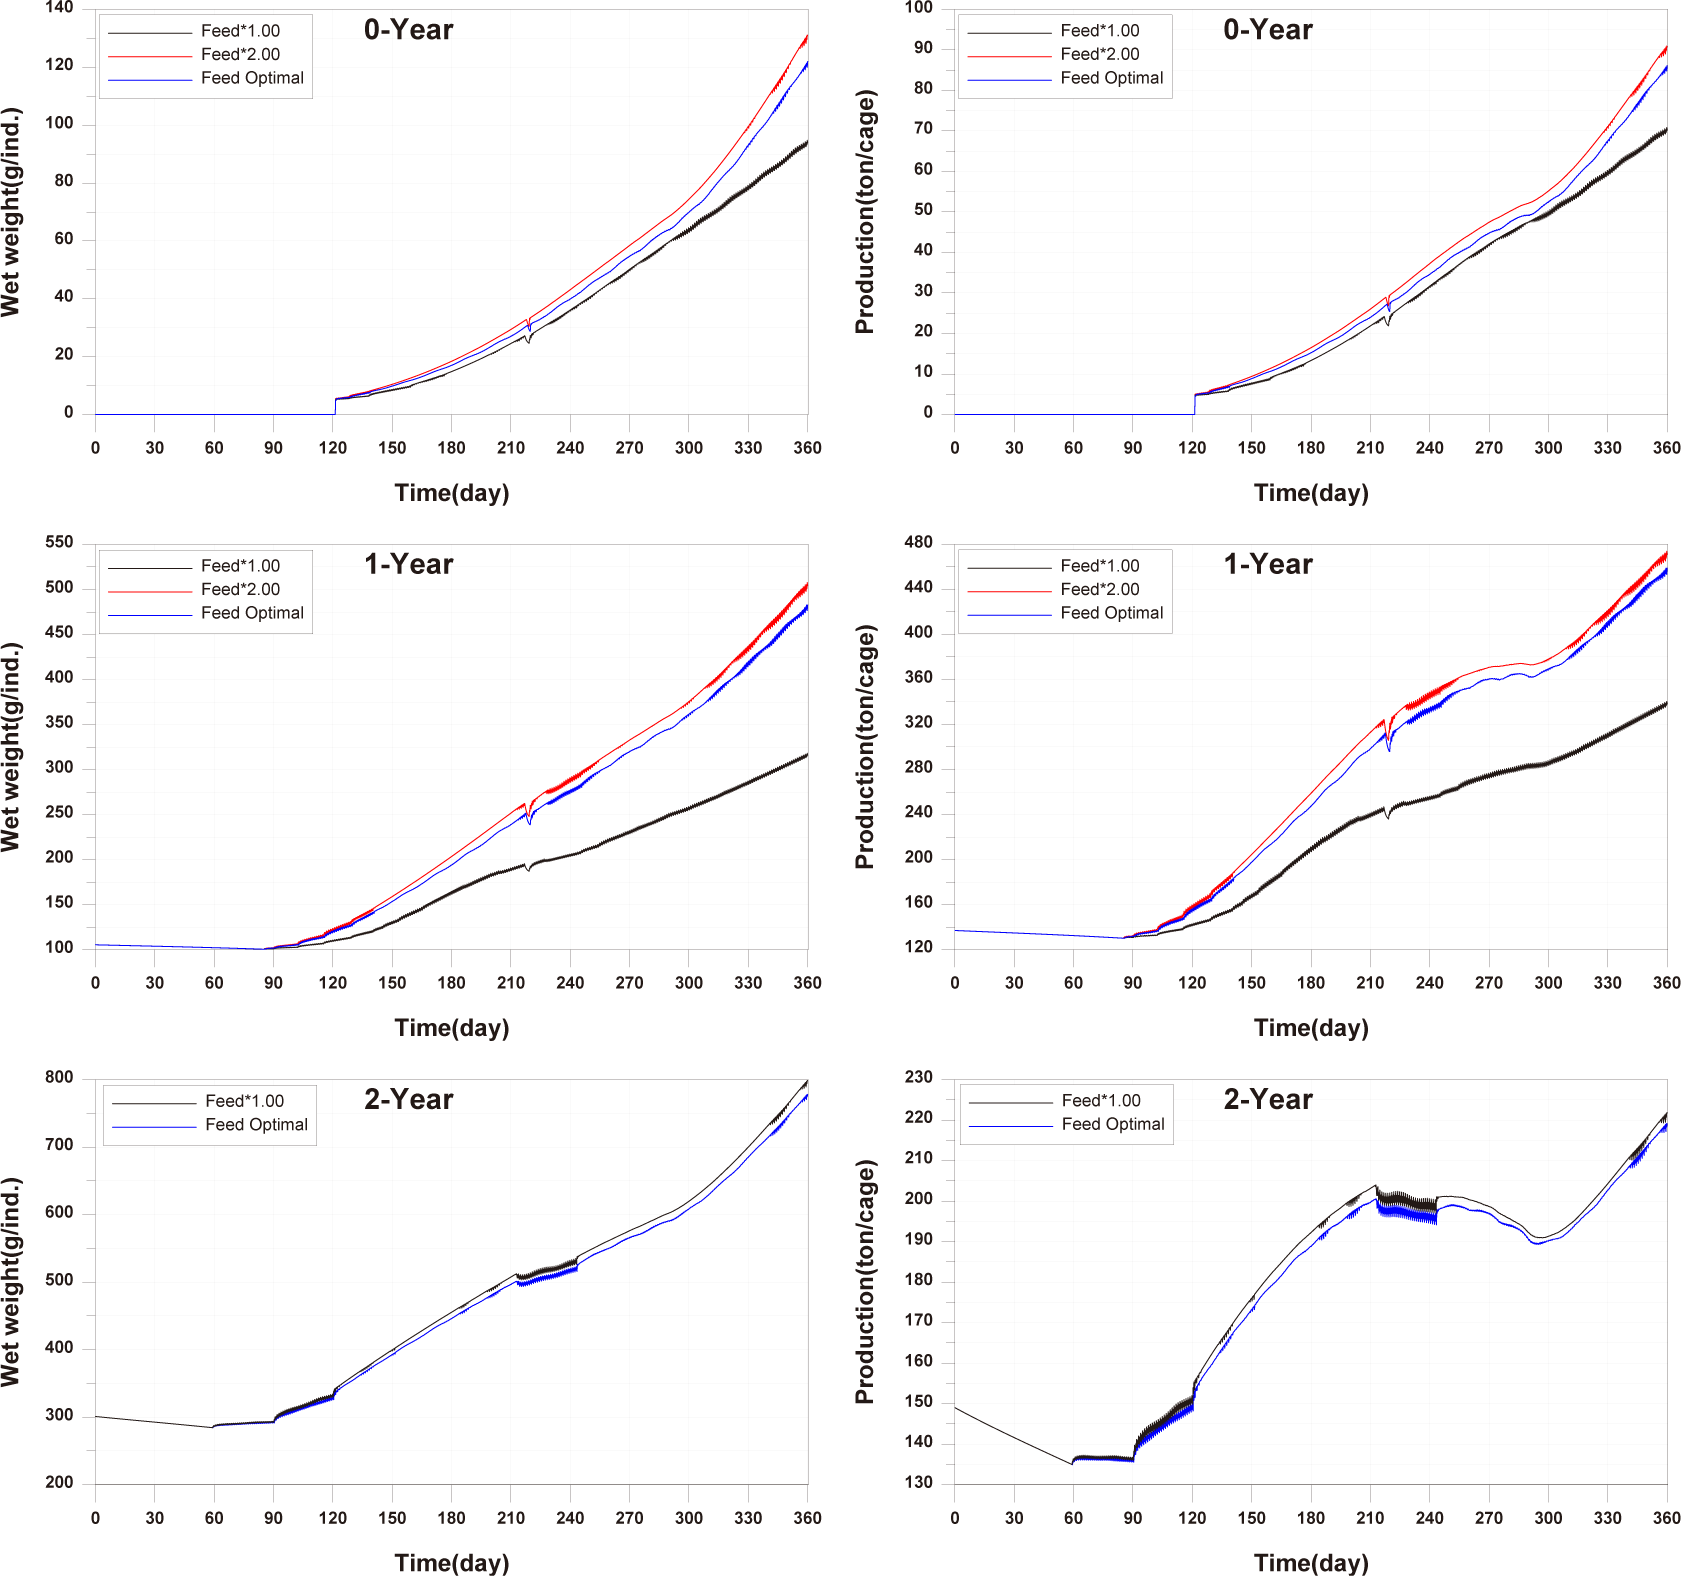
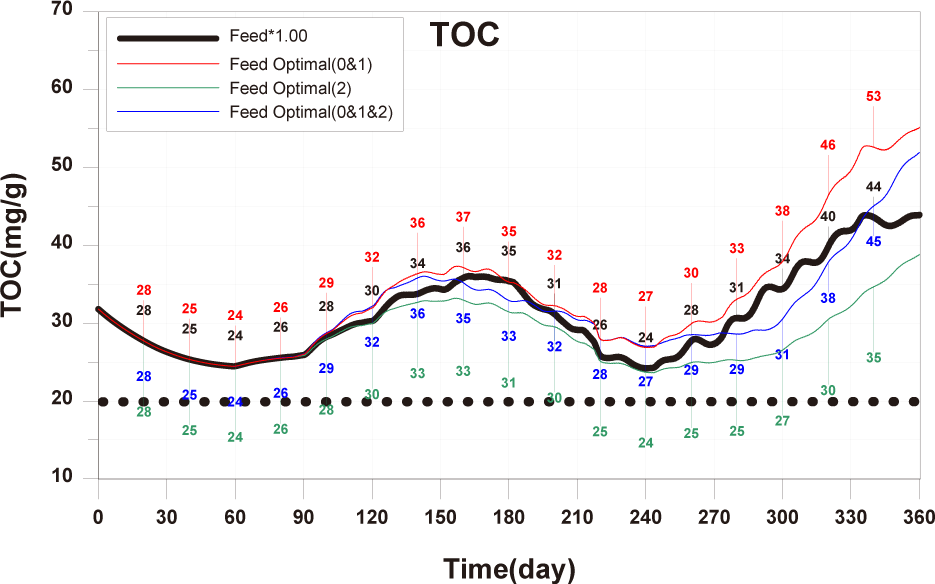
For 2-year-olds, a significant reduction in the occurrence of wasted feed is shown (Fig. 24). Individual growth and production quantity show a slight decrease, attributed to the sinking of feed (Fig. 25). It is anticipated that increasing feed input little beyond the calculated optimal feed input could minimize wasted feed while maintaining production quantity. The TOC in sediment improves as wasted feed occurrence decreases (Fig. 26).
In summary, if the calculated optimal feed input is applied for all each age groups, the TOC in sediment showed a level similar to the existing TOC concentration (Fig. 26). Additionally, for 0-year-olds and 1-year-olds, there were positive outcomes with increased individual growth and production quantity. Furthermore, conducting farming at a level to maintain the existing production quantity could potentially lead to a shortened farming period and improvements in sediment environment. Therefore, calculating and applied of optimal feed input appears to be a fundamental approach to establishing age-specific management plans.
When farming only 0-year-olds, individual growth increased with optimal feed input. While reducing the number of cages or stocking density and feed input resulted in a decrease in production quantity per fish farm compared to the existing method, the productivity was significantly higher than with the existing farming method. Moreover, reducing stocking density and feed input was more effective in increasing production quantity than reducing the number of farming facilities (Fig. 27). In terms of TOC in sediment, farming only 0-year-olds contributed to environmental improvement. However, as fish production increased in the later stages of farming, the sediment environment deteriorated rapidly from around day 300 onwards. Adjusting stocking density and feed input was more beneficial for improving sediment conditions compared to controlling the number of farming facilities (Fig. 28).
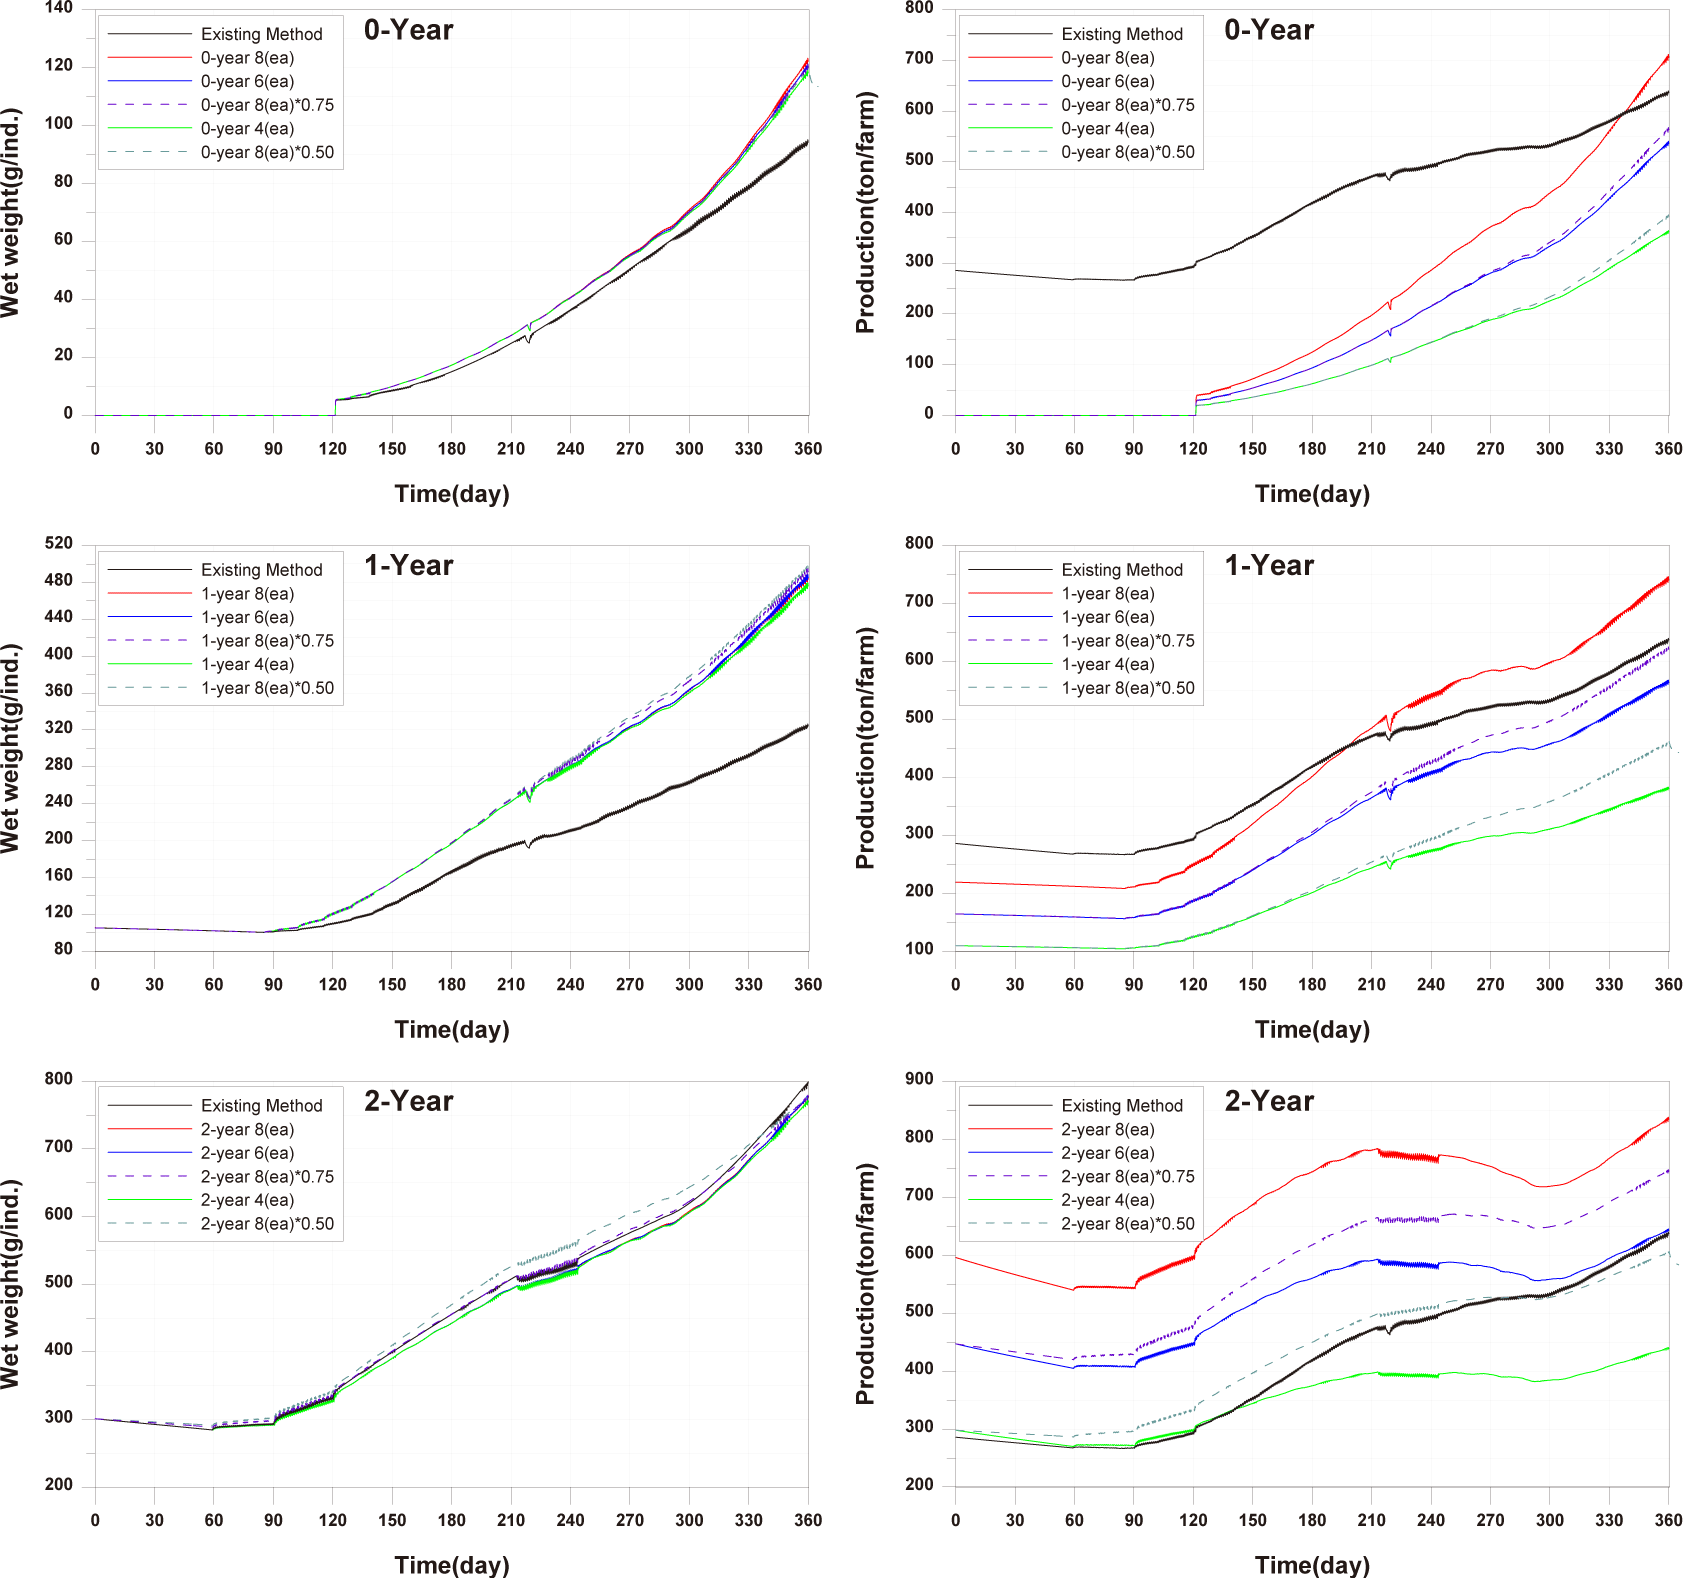
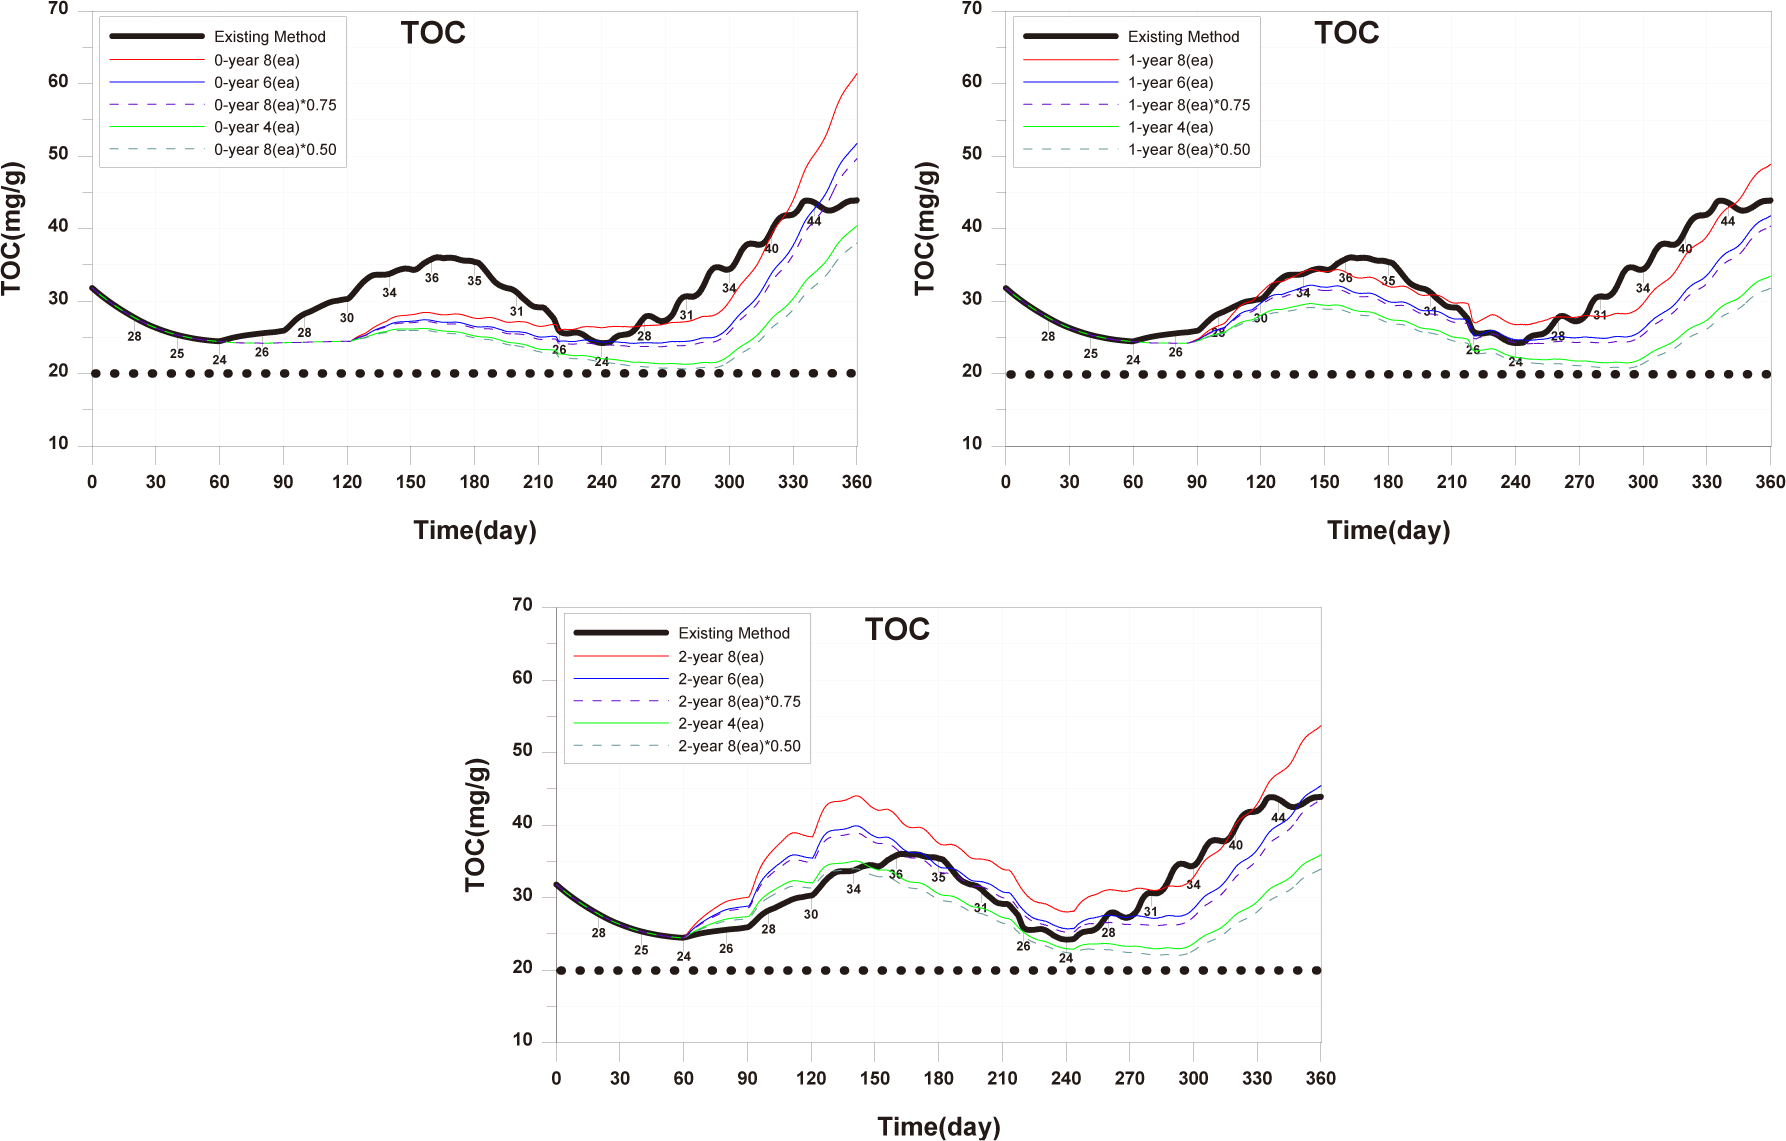
When farming only 1-year-olds, individual growth increased with optimal feed input. The production quantity was significantly higher when maintaining eight farming facilities compared to the existing method, and the productivity was higher than with the existing farming method. Reducing stocking density and feed input was more effective in increasing production quantity than reducing the number of farming facilities, and the magnitude of this increase was due to differences in stocking density (Fig. 27). TOC in sediment overall showed lower concentrations compared to the existing method, and the reduction in concentration was more significant when decreasing stocking density and feed input (Fig. 28).
When farming only 2-year-olds, there were periods of increased individual growth when a decrease in stocking density and feed input compared to the existing method. However, the final individual size was similar. This is attributed to the increase in stocking density as fish grow, limiting fish growth. With six farming facilities, the production quantity per cage remained the same as the existing production quantity, but the productivity decreased. However, when reducing stocking density and feed input, the production quantity increased significantly compared to other age groups, as the negative impact according to stocking density was reduced, as mentioned earlier. Additionally, with a 50% reduction, the production quantity approached the level of the existing farming method (Fig. 27). Farming only 2-year-olds generally resulted in a worsening of TOC in sediment, and the improvement in sediment conditions was more when reducing stocking density and feed input compared to reducing the number of farming facilities (Fig. 28).
In summary, reducing stocking density rather than decreasing the number of farming facilities showed positive outcomes, including increased individual growth, increased production quantity, and improved sediment conditions. Production quantity for only 0-year-olds was similar to the existing method. For 1-year-olds, a 25% reduction in stocking density, and for 2-year-olds, a 50% reduction in stocking density showed similar production quantities comparable to the existing farming method. Productivity and the degree of sediment improvement were highest for 0-year-olds, followed by 1-year-olds and 2-year-olds. However, it is significant that sedimentary environments have been deteriorating in all conditions since around day 300. If the farming period is shortened until around day 300, production quantity may decrease, but it is anticipated that conducting high-productivity farming while improving sediment conditions can be achieved.
Conclusion
Modelling can serve as a valuable tool for deriving management plans to address issues arising in marine fish cage farm. Fish production and the marine environment are intricately linked, requiring an integrated modeling approach. An integrated modeling approach that combines hydrodynamics, fish growth, and ecosystem (water quality and sediment) was applied to a marine fish cage farm located in Hadong-gun, Gyeongsangnam-do, South Korea. To ensure the reliability of the model, we aimed to reproduce observed values for water quality, sediment, and fish growth. Additionally, scenario analyses were conducted to derive management plans.
The results of the scenario analyses for deriving management plans are as follows: firstly, it is necessary to derive management plans for each age group because the required feed input, fish excretion, growth-limiting factors, etc., differ for each age group. Secondly, optimizing feed input for each age group can improve current farming methods. This approach can maximize fish growth, reduce feed waste, enhance environmental conditions, and increase economic benefits. However, sediment conditions may deteriorate in winter due to increased production. This can be addressed by shortening the farming period and adjusting feed input. Thirdly, it is more efficient to adjust stocking density rather than adjusting the number of fish farms. Reducing stocking density can decrease fish growth inhibition and mortality, contributing to sediment environmental improvement.
This model, based on an integrated understanding of the aquaculture ecosystem, is expected to be useful for deriving various management plans for marine fish cage farming.

