Introduction
Rasbora spp. is found in Southeast Asia, including Indonesia, especially in the islands of Sumatra, Java, Kalimantan, Bali, and Lombok (Hubert et al., 2019; Kusuma et al., 2016). Geographically, Indonesia’s mainland is separated from mountains and inland waters, which serve as a repository for germplasm, including rasbora fish diversity. Rasbora arundinata, Rasbora haru, Rasbora maninjau, and Rasbora bindumatoga are four new species discovered in North Sumatra, Indonesia (Lumbantobing, 2014). However, this diversity is at risk of extinction as a result of overfishing, and fish farming is one of sustaining methods for native fish stocks (Domingues et al., 2022; Pinsky & Palumbi, 2014).
Rasbora lateristriata, also known as wader pari, is a popular fish in Java. This fish has a delicious flavor and is high in protein (15.75%–47.54%), fat (12.36%), ferrum (2.9%), and zinc (3.46%) (Erhana & Retnoaji, 2019; Munthe et al., 2016; Sogandi et al., 2020). Wader pari cultivation is a way to meet market demands. R. lateristriata has been successfully cultivated in the laboratory, hatchery, and on a large scale (Manganang et al., 2020; Prasetyo & Retnoaji, 2019; Retnoaji et al., 2017; Zulfadhli et al., 2016). However, no attempt has been made to trace and compare the morphometric and genetic characters of Rasbora spp. cultivation and natural populations from several regions of Indonesia.
The truss network measurement (TNM) character, one of the morphometric measurement instruments is used to characterize the Rasbora spp. morphological diversity (Muchlisin, 2013). The identification of cultured and wild fish using morphometrics has been studied in the species Sparus aurata (Doğdu & Turan, 2021), Dormitator latifrons (Gonzalez-Martinez et al., 2020), and Clarias macrocephalus (Whan-Air et al., 2018). The mitochondrial cytochrome c oxidase (COI) gene is widely used as a marker gene for the taxonomic identification of fish. It is inherited maternally and is used to of compose fish kinship groups, including Rasbora spp. (Kusuma et al., 2016). R. lateristriata populations discovered in West Java, Central Java, and East Java populations may represent a cryptic species and species complex (Kusuma et al., 2016, 2017). To further understand the relationships between these populations, this study analyzed morphometric data and COI genes to distinguish Rasbora spp. from cultivated and wild stock, which will be useful for future cultivation development.
Materials and Methods
The research was conducted from September 2020 to December 2021. This research focuses on Rasbora spp. from five distinct populations: the cultivated population (Jogjakarta), the wild population on the island of Java (Purworejo and Malang), and the Sumatra population (Riau and Palembang) (Fig. 1). Cultivated fish is the fourth generation (G4), the progeny of the first generation (G0) that have been domesticated and bred through inbreeding. G4 is the result of the selection of phenotypes with great body size, rapid growth, and adaptability. The polymerase chain reaction (PCR) analysis was carried out in the genetic laboratory of the Research Institute for Inland Fisheries and Extension, Palembang. Sanger sequencing was performed at PT. Genetics Science.
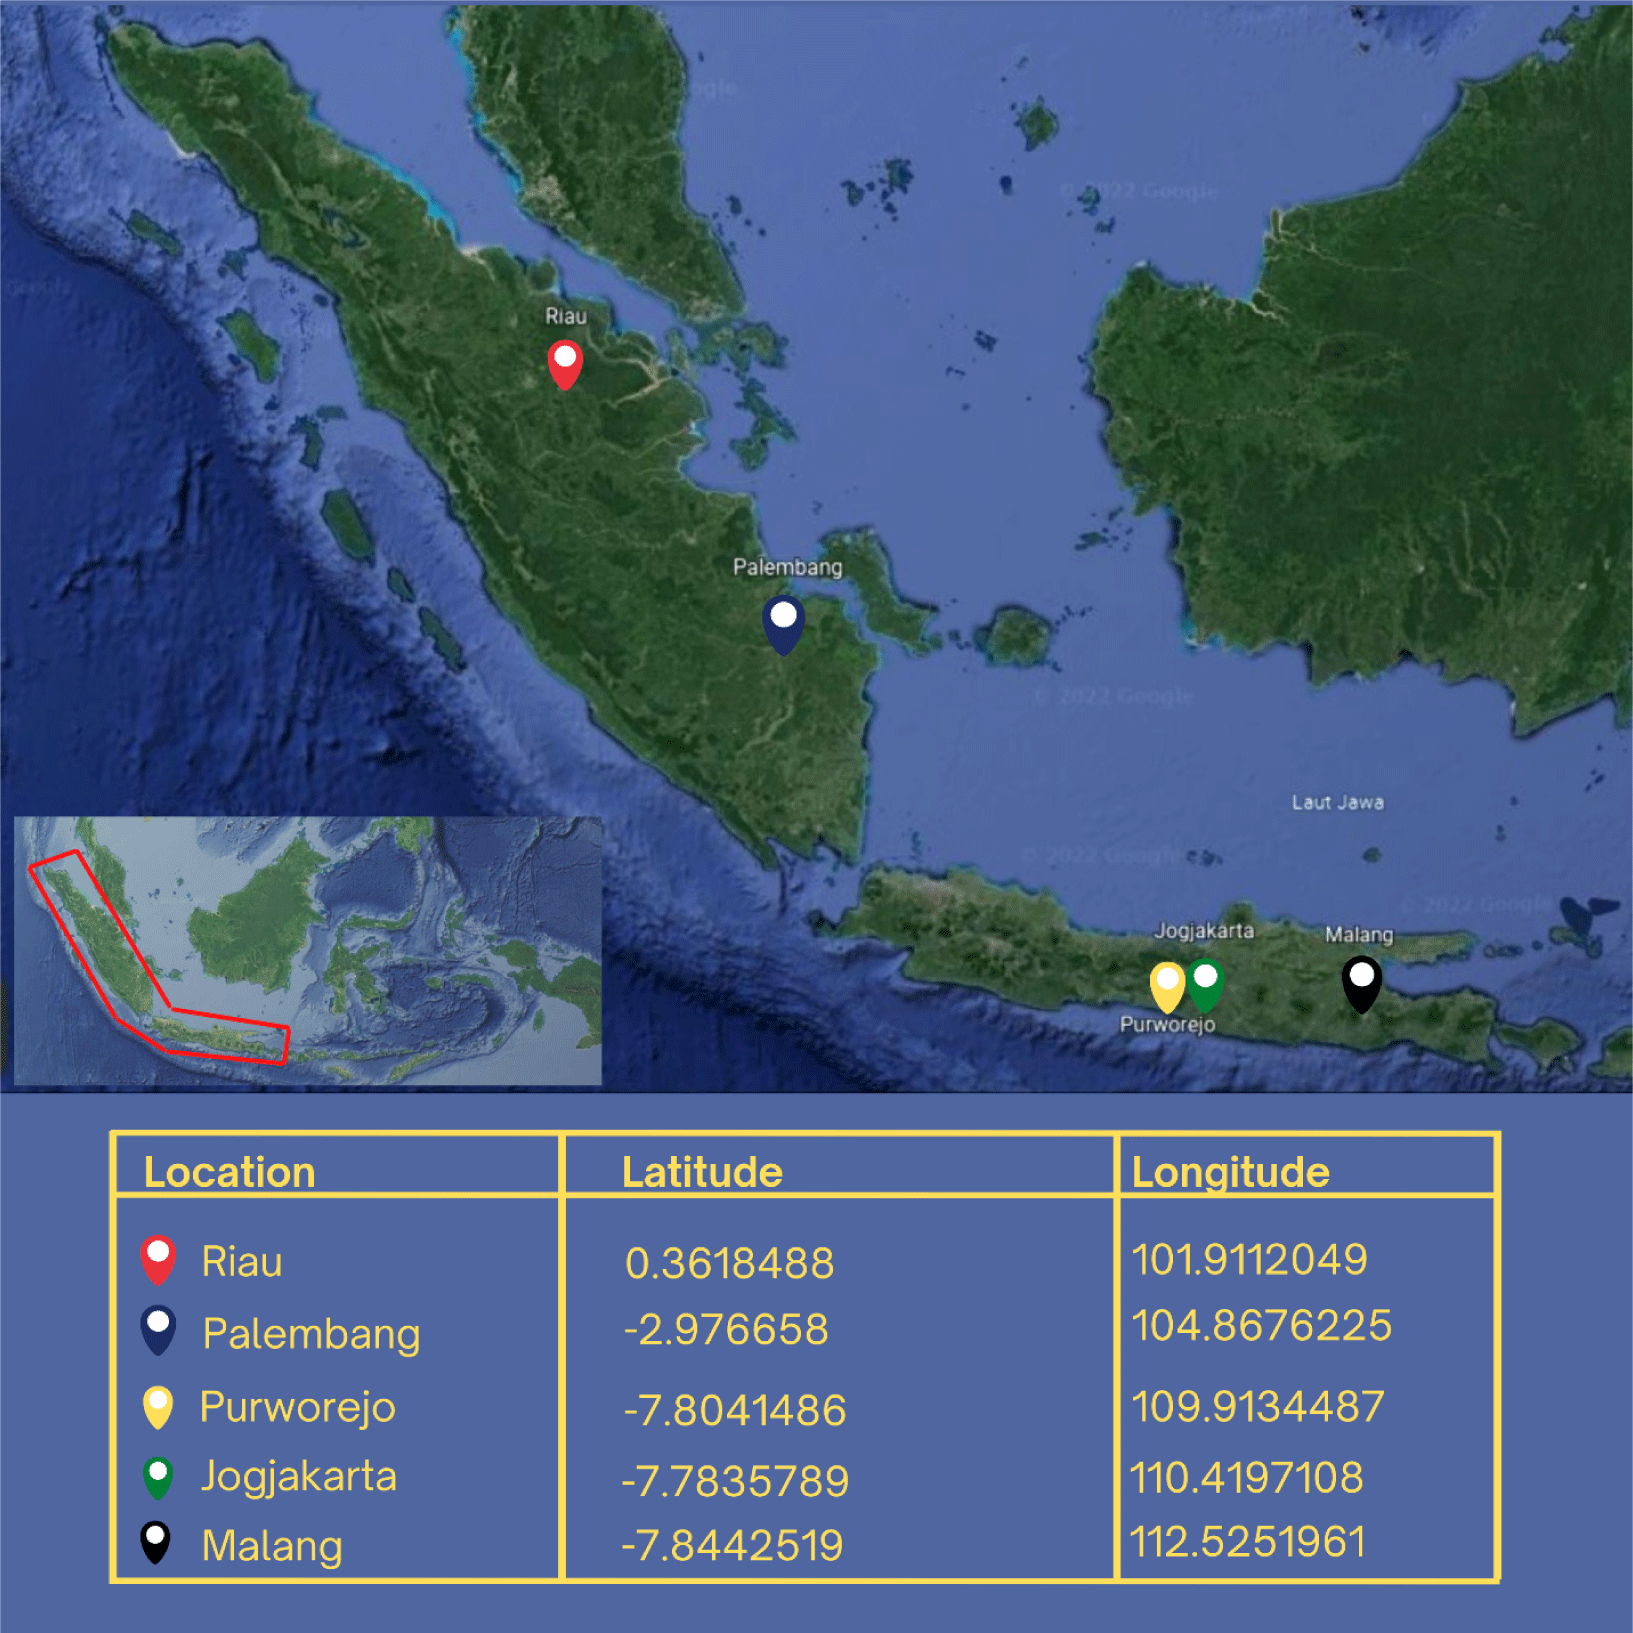
The sample for measuring TNM and gene specimens was collected in a single survey method. In total, 80 Rasbora spp. fish were collected and analyzed for TNM characters. The fish were collected from the populations of Jogjakarta (20), Malang (18), Purworejo (18), Riau (12), and Palembang (12). Rasbora spp. caudal fin tissue was collected as genetic material from the populations of Jogjakarta (6), Malang (6), Purworejo (5), Riau (4), and Palembang (3). The grouping refers to morphological characteristics, particularly along the fish’s lateral line (Hubert et al., 2019; Kusuma et al., 2016). Rasbora argyrotaenia is characterized by a distinct black lateral line that extends from the upper pectoral fins to the anterior caudal fins (Hubert et al., 2019). Rasbora dusonensis is distinguished by a black caudal fin posterior.
The manual caliper was used to determine the length of fifteen TNM characters and the total length (TL). The TNM landmark (Fig. 2) referred to Muchlisin (2013) and TNM components details are available in Table 1.

Caudal fin tissue was homogenized using a genomic GB100 DNA Kit, 70% alcohol, Genomic GB100 DNA Kit, loading dye, PCR mix-DNA ladder Bioline brand, methylene blue, primer Forward-Reverse COI gene, and Phosphate Buffer Saline were used for COI gene analysis. Digital scales, an aquarium, a 1.5 mL microtube, centrifugation, digital scales, a vortex, a hot air oven, a thermal cycler T100, an electroporator, a dissecting set, and a UV transilluminator were used as tools.
Sampling was conducted using a random sampling technique from nine distinct populations. Fish from each location are transported to the laboratory for anesthesia by lowering the temperature of the water in the fish rearing container to 4°C for ± 3 min. The water temperature is lowered by administering ice gel. DNA tissue was taken from the caudal fin using a dissecting set and stored in a microtube containing 70% alcohol. DNA isolation was carried using a Genomic GB100 DNA kit to obtain DNA material purification: sample preparation, lysis, binding, washing, and elution following the previous method (Muslimin et al., 2020a). The DNA isolate products were prepared for PCR amplification by adding 12.5 µL of PCR mix ingredients. These included 6 µL of 2× MyTaq HS Red Mix (Bioline, Little Clacton, UK), 5 µL of Nuclease-Free Water, 0.5 µL of forward and reverse primers, respectively, and 0.5 µL of total DNA. The COI primer used were FishF1-5’TCAACCAACCACAAAGACATTGGCAC’3 (forward) and FishR1-TAGACTTCTGGGTGGCCAAAGAATCA’3 (reverse) (Ward et al., 2005). The PCR amplification temperature was programmed in five stages: initial denaturation for 3 min, continued denaturation for 3 s at the same temperature (94°C) with 30 cycles, annealing (55°C) for 30 s, initial extension for 90 s, and final extension for 8 min at the same temperature (72°C). The base length amount of the PCR outcomes were visualized on 1% agarose under UV light. Finally, the DNA was purified, and the nucleotide base sequences were identified by Sanger sequencing.
Analysis of variance (ANOVA) was used to determine which characters are significantly different among populations. Furthermore, 15 TNM characters’ data were processed using multivariate statistical analysis via the discriminant function analysis (DFA) method. These characters were adjusted using Turan (1999) data transformation formula to determine the strength of variation between 15 fish morphometric characters (p < 0.05). The formula is as follows:
The DFA test eliminates insignificant characters based on their eigenvalues. ANOVA and DFA data analysis were performed using the IBM SPSS version 23.0 program (Armonk, NY, USA).
Data analysis for phylogenetic tests was performed using the Bioedit application, DNASP version 5.0, and MEGA version X. The National Center for Biotechnology Information (NCBI) platform was used to identify the species using the Basic Local Alignment Search Tool (BLAST). The maximum likelihood method, Kimura2 parameters, and the preparation of bootstraps with 10,000 repetitions were used in the phylogenetic analysis (Kimura, 1980).
The analysis of nucleotide diversity was conducted using analysis of molecular variance with DNASP version 5.0 and Arlequin 3.5.2.2 program (Excoffier & Lischer, 2010). The Network NETW 10.20 program was used to analyze the network haplotype reconstruction.
Results
The Rasbora spp. in this study were classified as R. argyrotaenia (Jogjakarta and Purworejo), R. lateristriata (Jogjakarta, Malang, and Purworejo), Rasbora einthovenii (Riau), and R. dusonensis (Palembang). The COI gene was used to confirm the species identity of all specimens. Fig. 3 illustrates the morphology of the five species examined in this study.
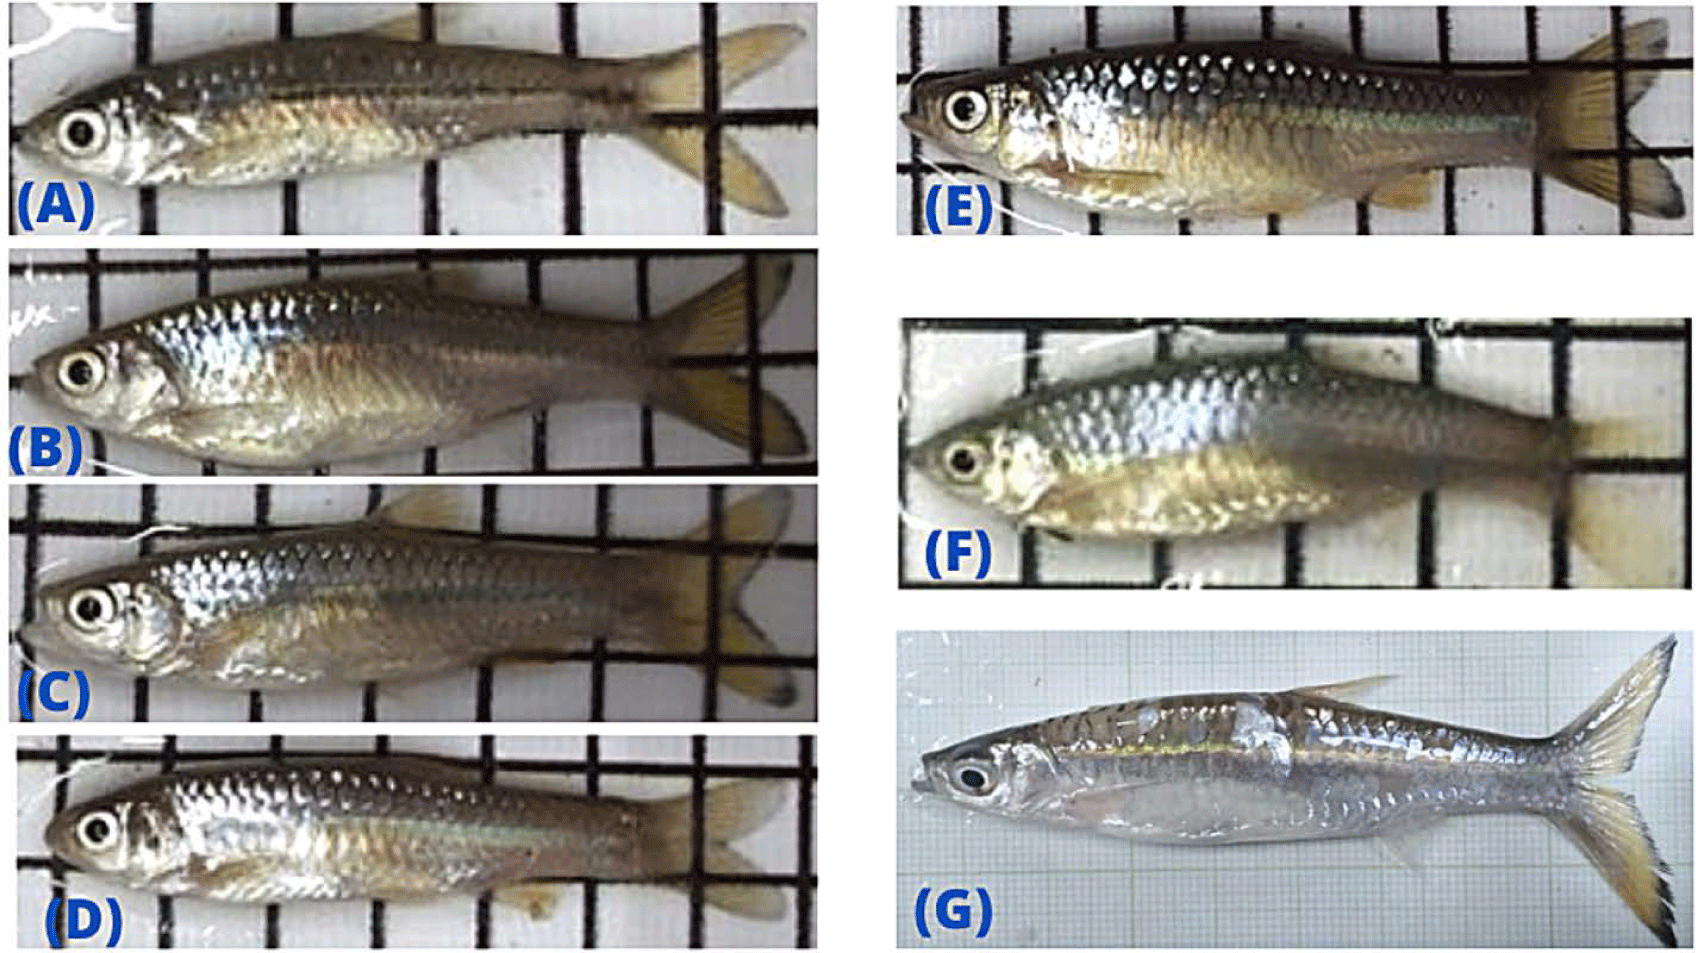
Table 2 summarizes the mean values for fifteen TNM characters and the rasbora fish’s length. Significant difference is followed-up using Tukey analysis, with significantly different characters (p < 0.05) denoted by superscripts. R. dusonensis from Palembang had the highest mean that was significantly different for all characters. R. lateristriata in the Malang population vary significantly according to R2, R10–R15, and TL characters.
Based on the value of the Wilks lambda, the DFA test divides fifteen characters into six functional groups (Table 3). The discriminatory character in the function discriminant group is determined based on the eigenvalue, percentage of variation, and canonical correlation. The greater the value of the three, the stronger the variant character of each group (Muslimin et al., 2020b). The highest eigenvalues were discriminant function 1 (df1; 2.43) and df2 (1.58). The df group with the highest percentage of variation is df1 (43.9%), followed by df2 (28.6%). The highest canonical correlation values (> 0.65) are df1 (0.84) and df2 (0.78). The distinguishing character is determined using df1–df3, as this group contains the significant discriminant. The significant characters are denoted by superscripts (R12, R11, R2, and R10). According to the percentage of variance, eigenvalues, and canonical correlation values, df1 and df2 are significantly different discriminant characters (p < 0.05). These characters, R2, R10, R11, and R12 are denoted by a superscript.
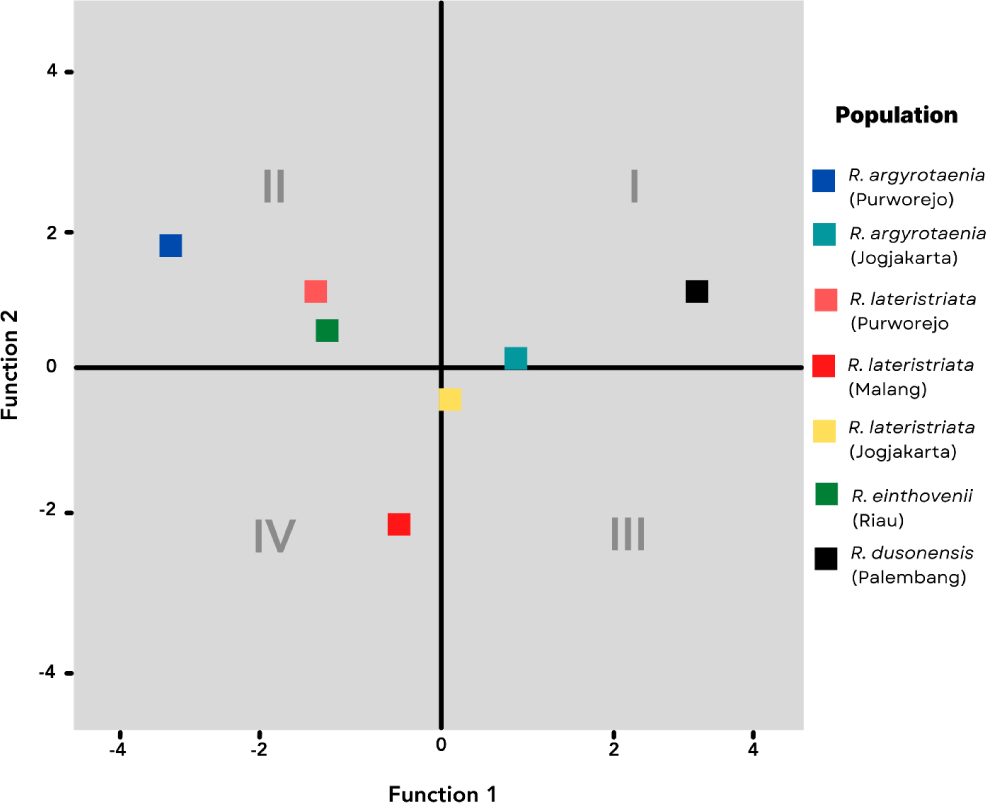
The canonical coefficient values of discriminant functions are plotted and summarized to represent the centroid points of populations and species, respectively. Fig. 4 illustrates the distribution of centroid points. The four quadrants classify the population according to the discriminant characteristics listed in Table 3. In Quadrant I, the R. dusonensis (Palembang) and R. argyrotaenia (Jogjakarta). Quadrant II contains the R. argyrotaenia (Purworejo) and R. lateristriata (Purworejo) populations from Purworejo, as well as the R. einthovenii (Riau) population from Riau. R. lateristriata are the species found in Quadrant III (Jogjakarta). R. lateristriata form Malang is found in quadrant IV (Malang).
Confirmation of species was carried out using the COI gene BLAST results and is shown in Table 4. R. lateristriata and R. argyrotaenia species constitute the cultivated population in Jogjakarta. R. lateristriata and R. argyrotaenia are found in the Purworejo population. R. lateristriata is the native species in Malang, R. dusonensis is the endemic species in Palembang, and R. einthovenii is the local species in Riau. The sequencing results have been submitted to the NCBI database containing Table 5.
The Rasbora spp. nucleotide sequence was compared to NCBI BLAST data for the COI gene of R. lateristriata of the Pasuruan population (Accession No. LC130692.1) to construct a phylogenetic tree. The Rasbora spp. kinship tree, constructed using MEGA X and 10,000 repetitions, revealed five distinct clades. Fig. 5 illustrates the relationship between cultured fish (Jogjakarta) and wild stock populations (Malang, Purworejo, Palembang, and Riau). Clade I (R. lateristriata from Purworejo, Jogjakarta, and Malang), Clade II (Rasbora agryotaenia form Jogjakarta and Purworejo), Clade III (R. dusonensis form Palembang), Clade IV (R. einthovenii from Riau), and Clade V (R. lateristriata from Purworejo).
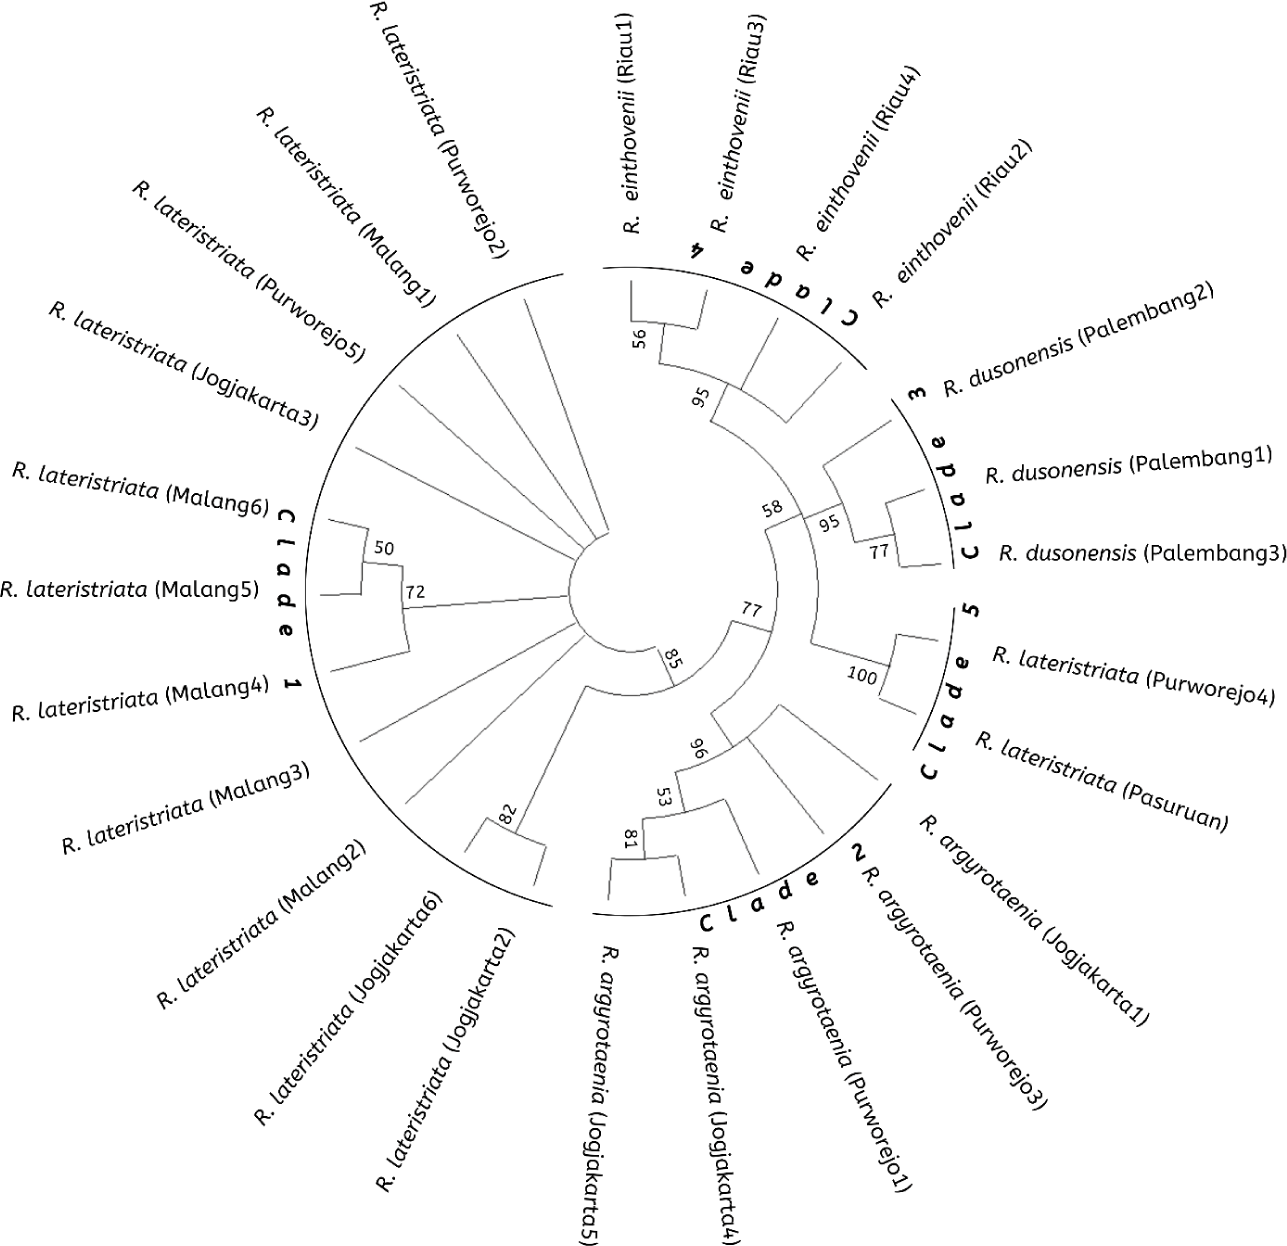
Table 6 displays the results of calculating genetic distance using Kimura 2 parameters with 10,000 replications and nucleotide diversity coefficients among populations using Nei’s (1972) analysis. The R. lateristriata (Jogjakarta and Malang) had the lowest fixation coefficient (0.00), while the R. argyrotaenia (Purworejo) and R. dusonensis (Palembang) had the highest fixation coefficient (0.96), not significantly different, respectively. The R. argyrotaenia (Purworejo) and R. dusonensis (Palembang) had the lowest nucleotide diversity (0.00), significantly different (p < 0.05), respectively. Meanwhile, R. lateristriata (Purworejo) exhibited the greatest diversity of nucleotides (0.43) with the statistically insignificant difference.
The bottom diagonal represents the FST value, while the top diagonal represents the p-value. Information for population 1: Rasbora argyrotaenia (Jogjakarta), 2: R. argyrotaenia (Purworejo), 3: Rasbora lateristriata (Jogjakarta), 4: R. lateristriata (Purworejo), 5: R. lateristriata (Malang), 6: Rasbora dusonensis (Palembang), and 7: Rasbora einthovenii (Riau).
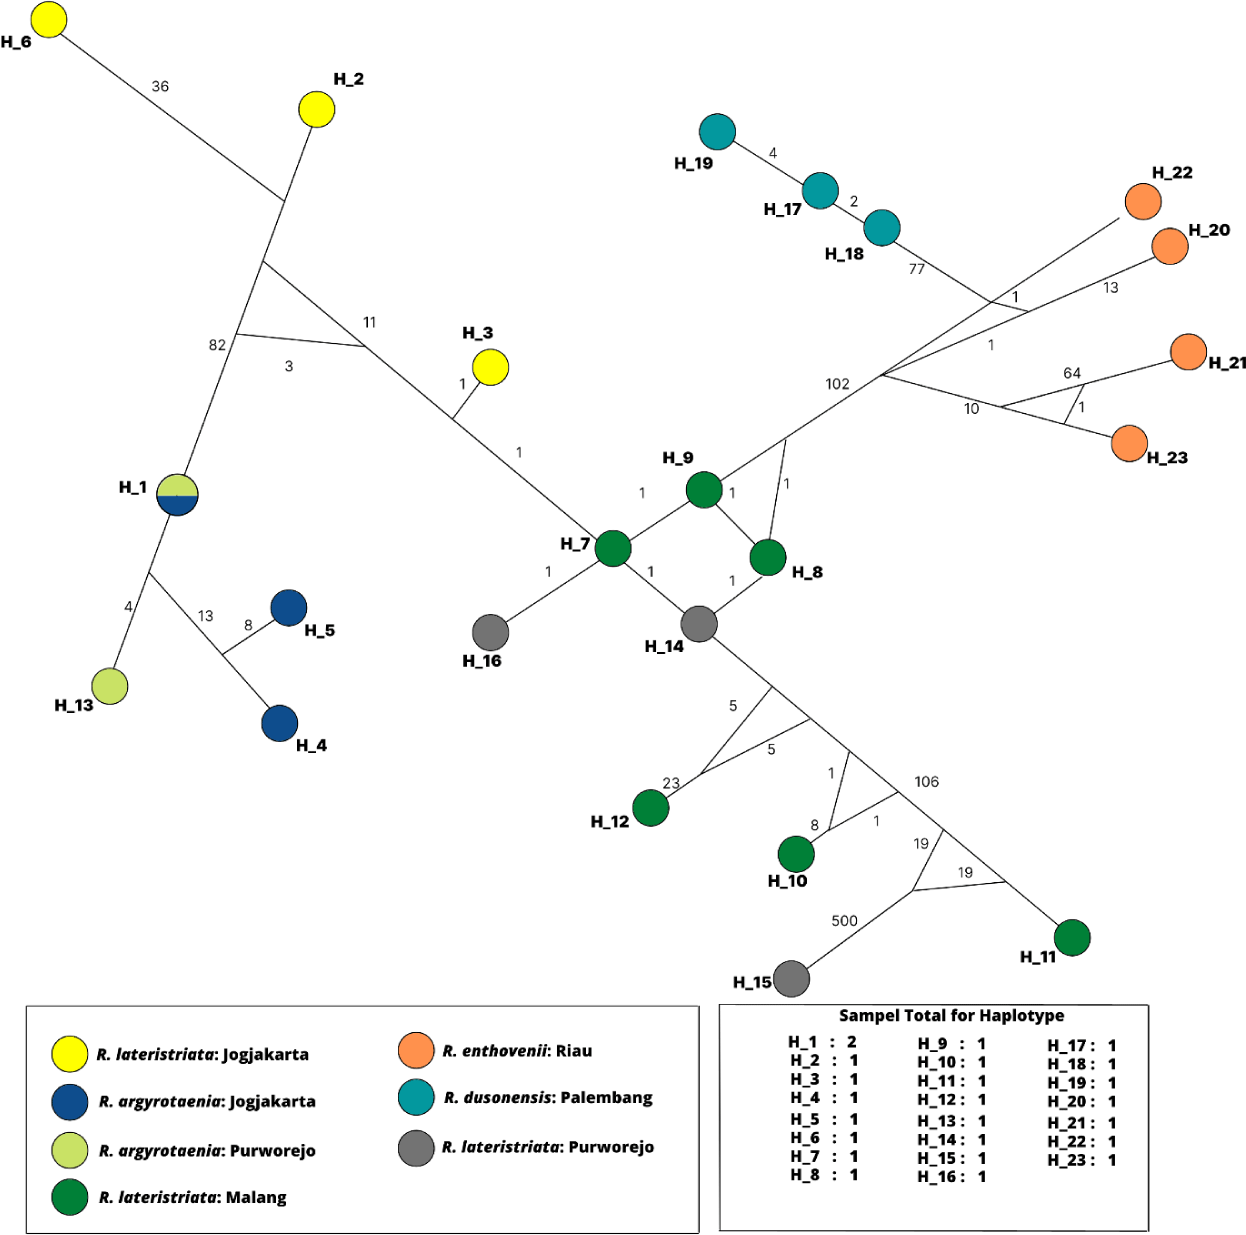
All specimens’ haplotype relationships were analyzed using the SP DNA program and Network 10.2.0.0, as shown in Fig. 6. The total number of haplotypes produced was 23 color-coded according to the population. The genetic structure of H1 to H23 demonstrates a mutation indicated by a number on the connecting line between the haplotypes. H1 comprised of R. argyrotaenia from Jogjakarta and Purworejo. Except for H15 (R. lateristriata from Purworejo), intraspecies mutations exhibit a low mutation rate and higher variation interspecies between H6 (R. lateristriata from Jogjakarta) and H15 (R. lateristriata from Purworejo).
Discussion
R2, R10, R11, and R12 are the TNM characteristics that distinguish cultivated fish (Jogjakarta) from wild type (Purworejo, Malang, Palembang, and Riau) (Table 3). Palembang’s population is larger and significantly more diverse in all dimensions (Table 2). R2, R10, R11, and R12 of R. lateristriata wild type (Malang) were significantly different in length (p < 0.05). Pinna dorsalis (R2) R. lateristriata (Malang) is longer than in other populations. Pinna dorsal length variation can be influenced by geographical conditions, fish stocking density, water quality, and sexual dimorphism (Brown et al., 2016; Klima et al., 2013). R10, R11, and R12 denote the average height of fish in each population. R. lateristraiata (Malang) is significantly taller in the wild than in the cultivated population. Similar findings were made in the S. aurata (Šegvić-Bubić et al., 2014) and R. lateristriata (Harris et al., 2021). This character difference is thought due to morphological characteristics inherited from previous generations, the season, food availability, and age (Doğdu & Turan, 2021).
Otherwise, R2, R10, R11, and R12 of farmed R. argyrotaenia (Jogjakarta) were the longest than the wild type (Purworejo). A similar discovery on the cultivated fish of D. latifrons (Gonzalez-Martinez et al., 2020). This is because cultured fish are selectively bred to produce offspring with larger body types (Doğdu & Turan, 2021). The fin size of cultured fish can be influenced by aquaculture water settings such as water discharge, stocking density, volume, and feeding (Doğdu & Turan, 2021). The difference in character results between R. lateristriata and R. argyrotaenia in cultivated and natural populations are believed due to genetic and environmental factors (Whan-Air et al., 2018).
Rasbora spp. has been classified into four groups based on the four distinct TNM characters (Fig. 4). In quadrant III, cultured fish (R. lateristriata) on Jogjakarta into a single group and separated them from wild type group, however, R. argyrotaenia (Jogjakarta) shared morphological characteristics with the wild type (R. dusonensis). This can be a result of environmental factors influencing morphological variation. These environmental influences can be classified as internal (genetic flow, inherited features, and disease) or external (environmental factors such as climate change) (predators, temperature, water level, and geography) (Aminan et al., 2020; Whan-Air et al., 2018).
The fish group Rasbora spp. was classified into five clades (Fig. 5). R. argyrotaenia was found to be in a distinct clade from R. dusonensis and R. eitnhovenii. Aminan et al. (2020) found different results, placing R. argyrotaenia and R. dusonensis in the same clade and a separate clade from R. einthovenii. In contrast, R. lateristriata Purworejo, which is separate from other clades, was identified in this study (Clade 5). R. lateristriata is a species with a high degree of gene variety on the Indonesian island of Java (Kusuma et al., 2016). This is demonstrated by Clade 1 (Fig. 5) and its sub-clades. One of the subclades has a bootstrap value of 77%, indicating that the populations (East Java and Central Java) and some cultivated populations (Jogjakarta) are relatively distantly connected. Indeed, Clade 5 places the population of Purworejo (Central Java) in the same group as the Pasuruan (outgroup) population in East Java.
Sholihah et al. (2020) classify R. lateristriata of Central and East Java as a single species. Otherwise, Kusuma et al. (2016) declared that Central and East Java populations are distinct. These group distinctions can be attributed to variances in subpopulations or domestication influences on fish genetic diversity. Similar discoveries have been made for Atlantic salmon and sturgeon species, which exhibit variation between cultured and wild fish, and it is hypothesized that genetic change happens both naturally (genetic pool, genetic drift, and gene flow) and as a result of cultivation (cross-breeding and generational differences) (Besnier et al., 2015; Zhang et al., 2013). Therefore, additional research is necessary to ascertain the genetic diversity of the next-generation cultivars of R. lateristriata.
Fixation index (FST) indexation represents gene differentiation (Willing et al., 2012). Pairwise FST scores between the cultured and wild type of C. macrocephalus are 0.013–0.039 (Duong & Scribner, 2018) and Piaractus mesopotamicus is 0.0015–0.055 in range (Pazo et al., 2021). In this study, the lowest gene differentiation was observed between R. lateristriata (cultivated population from Jogjakarta) and natural resources (Malang) (Table 6). The low FST value observed in this study could be explained by the two populations sharing the same parental origin (Doğdu & Turan, 2021). Additionally, connected waters, restocking in the wild from cultured fish, and mass recruitment of fish from nature could be affected by gene differentiation (Duong & Scribner, 2018).
According to Mccusker & Bentzen (2010), nucleotide diversity has a low value (0.3) and a high value (> 0.4). In this study, R. lateristriata (Jogjakarta) gene heterozygosity was low (0.04), but R. lateristriata (Purworejo) gene heterozygosity was high (0.43). Both population’s intraspecific morphology exhibits low heterozygosity. That could influence the high proportion of A-T nucleotides, contributing to transversion mutations, frameshift mutations, and non-synonymous amino acids dominating (Muslimin et al., 2020a; Ramadhaniaty et al., 2018). The highest nucleotide diversity resulted in a cultivated population, i.e., R. lateristriata (Jogjakarta), with adenine (29.08%), thymine (26.24%), guanine (26%), and cytosine (18.68%). While R. lateristriata (Purworejo) has the highest nucleotide diversity in non-cultivated populations, with nucleotide structure consisting of adenine (28.36%), thymine (27.51%), guanine (23.33%), and cytosine (20.81%).
Haplotype connections are used to characterize the relationship between species from distinct populations based on the genetic distance between gene mutations (Ramadhaniaty et al., 2018). The cultivation of R. argyrotaenia in Jogjakarta is interspecifically considered to share genetic material with the Purworejo population. Jogjakarta and Purworejo are geographically adjacent and share a watershed. Fish from distinct geographical areas with connected waterways could share the same gene source, which involves gene flow and causes a low genetic divergence between populations (Pazo et al., 2021; Ramadhaniaty et al., 2018). Reduced gene diversity can be affected by a bottleneck effect that occurs naturally or as a result of human activity, such as overfishing (Doğdu & Turan, 2021; Pazo et al., 2021). Another influential element is human-caused fish translocation (Muslimin et al., 2020b).
The cultivated R. lateristriata (Jogjakarta) haplotype is not genetically related to natural populations (Malang and Purworejo). The results are identical to the farmed fish of C. macrocephalus that have been bred with high-intensity wild stock, potentially boosting gene diversity (Duong & Scribner, 2018). There was no evidence of genetic exchange between the Malang and Purworejo populations. R. lateristriata and R. argyrotaenia are well-known species with a diverse gene pool from East and Central Java, respectively (Kusuma et al., 2016). This is because the physical barrier of the water between geographical areas restricts gene flow (Doğdu & Turan, 2021). High mutation rates can result in changes in codons, amino acid composition, and frameshift mutations and influence fish morphometric characteristics (Muslimin et al., 2020a).
This study found relatively low intraspecific gene diversity in farmed fish. A gene selection program to increase fish gene diversity on an aquaculture scale is essential for further breeding development. Low-diversity genes in a population of the same fish species tend to have the same gene flow. The impact of gene homogeneity within the same fish species can result in harmful mutations, reduce environmental adaptation, and lower survival rates (Duong & Scribner, 2018; Furlan et al., 2012). The genetic differences in cultured fish must be considered to produce heterozygous fish, minimize inbreeding, and enhance genetic drift and genetic flow variation. A sustainable breeding program can be implemented by focusing on gene variation in the selection of traits/characteristics such as environmental adaptability, accelerated fish growth, reproduction, and disease resistance (Carvalho, 1993). According to the findings of this study, the Purworejo population possesses a variety of fish genetic resources that could serve as a source of genetic material for future breeding. The aquaculture development program will advance by recruiting potential parents from this population using genetic selection techniques related to growth and inbreeding traits.
Discriminant function analyses revealed a distinct group of cultivating R. lateristriata and R. agryotaenia from a non-cultivating group. Lower genetic differentiation in farmed R. argyrotaenia and R. lateristriata than in wild stock, thereby necessitating the development of additional genetic selection programmes for breeding. In conclusion, the characteristics of the COI genes of farmed fish (R. argyrotaenia and R. lateristriata) tend to be homologous interspecies, except R. lateristriata (Purworejo), which can be used as a new genetic source for future aquaculture research.
