Introduction
According to the Food and Agriculture Organization of the United Nations (FAO), the world’s consumption of aquatic foods was 20.2 kg per capita in 2020 and is expected to increase by an average of 21.4 kg per capita in 2030 (FAO, 2022). Consumption in Africa was 10.0 kg per capita in 2020, lower than the average world consumption, and is expected to decrease by 9.8 kg per capita by 2030 because the population growth in Africa is outpacing the growth supply (FAO, 2022). In addition, the situation in which cultivation area continues to decrease due to climate change is threatening food security in Africa.
In Uganda, fisheries are a major food source and vital to livelihood and local economics, Uganda’s fish consumption was estimated at 10.0 kg per capita in 2020. Over 50% of Ugandans consume fish as their primary source of animal protein (MAAIF, 2020). Aquaculture in Uganda was estimated to have begun in 1941, and aquaculture production increased steadily from 31 tons in 1981 to 123,897 tons in 2020 (FAO, 2023b). The main aquaculture species in Uganda are North African catfish (Clarias gariepinus) and Nile tilapia (Oreochromis niloticus), which together account for over 90% of total production from 1984 to 2021 (FAO, 2023b).
Uganda’s aquaculture system includes earthen ponds, cage/pen, and tank/raceway cultures (MAAIF, 2020). Among these systems, the earthen pond culture system involves digging the ground and building an embarkment on a flat land or a shallow valley. Cage/pen culture systems are installed with nets in large water bodies, such as lakes, rivers, and dams. The tank culture system was technology-intensive and generated a higher initial investment cost than that in the other two systems. However, it also has the advantage of controlling the cultivation environment.
Earthen pond culture and cage/pen culture systems are easy to install and extend their size if only the appropriate site is secured. They have the disadvantage of being greatly affected by weather and exposure to predators, and they have a limited capacity for biosecurity control (MAAIF, 2020). In particular, cage culture can cause water pollution and eutrophication because feed and fish excrement contain large amounts of phosphorus, which can pollute drinking water resources.
The key aquaculture species of Uganda, O. niloticus is an African freshwater cichlid and one of the world’s most important food. It is the predominantly cultured species worldwide, and aquaculture production of O. niloticus was 98,471 tons in 2021, which more than tripled compared with that in 2010 (FAO, 2023a). Climate change and food security are global issues, and Uganda is no exception to the effects of climate change. Over the past few decades, Uganda has experienced more erratic rainfall, frequent river collapses, landslides, etc. (Oyebola et al., 2021). Temperature is also gradually increasing (Nsubuga & Rautenbach, 2018). In addition, the increase in flood frequency causes pond overflow and land-based waste to flow into the pond, which affects aquaculture production (Oyebola et al., 2021). Therefore, switching to an indoor aquaculture system should be considered to increase in adaptation of climate change and maintain stable livelihood of fish farmers.
The most important environmental factors in indoor aquaculture systems are water quality, light, and temperature. Among the factors, light can increase aquaculture productivity by controlling the wavelength, light intensity, and photoperiod. Incandescent and fluorescent lighting systems are traditional artificial sources of environmental lighting for fisheries. However, in recent years, efficient artificial light sources have replaced LEDs. Although LEDs have the disadvantage of high initial installation costs, they are widely used in fisheries because of their narrow bandwidth output and ability to permit intensity and spectrum manipulation to simulate environmental conditions that match the sensitivities of the target species (Migaud et al., 2007). In addition, LEDs have lower power requirements, lower electrical running costs, and longer lifespans than those of standard metal halide bulbs (Migaud et al., 2007).
It is important to select appropriate light conditions for target species in indoor aquaculture because each species has different visibility. In previous studies analyzing the effects of LED lights on cultured fish, blue (450–495 nm) and green (495–570 nm) lights increased the activity of antioxidant enzymes and AChE in the liver of rainbow trout (Oncorhynchus mykiss) (Güller et al., 2020). In addition, blue light (420–495 nm) prevented ocular elongation of rainbow trout. Ocular axial length is generally considered a major determinant of myopic refractive error. Ocular axial length of juvenile rainbow trout exposed blue light was shorter than other fishes exposed green and red lights (Timucin et al., 2016). Thus, blue light may be an effective light source for eye condition of fish compared to green and red lights in the rainbow trout culture. Other studies of the effects of blue light show that blue light (450 nm) increased growth performance, antioxidant activity, and pathogen resistance of juvenile turbot (Scophyhalmus maximus) (Wu et al., 2021), and the light (405–465 nm) reduced activity of parasites (Miamiensis avidus) in olive flounder (Roh et al., 2018).
However, for juvenile rock bream (Oplegnathus faciatus), green light (520 nm) was effective to decrease oxidative stress, apoptosis, and DNA damage when the fish were exposed to over 25°C (Choe, 2019; Choe et al., 2017). This result is consistent with the result that rock bream was more active despite the temperature increase over 25°C under green light (518 nm) (Heo et al., 2017). For olive flounder (Paralichthys olivaceus), green light (508 nm) had a positive effect on growth performance of olive flounder (Benedict et al., 2019), and adjusting the intensity of green light (520 nm) can heal wounds of olive flounder (Lee et al., 2023). In the study on rockfish (Sebastes inermis), green light (518 nm) had a positive effect on growth performance, while rockfish was more active under red light (622 nm) (Heo et al., 2016; Shin et al., 2015). It was found that the wavelengths of LED light affect different physiological factors for each target species.
Although water temperature, light intensity, and photoperiod conditions were all different in the previous studies, these studies suggest that it is necessary to find a suitable wavelength for aquaculture system design considering growth performance, stress relief, pathogen resistance, etc. of the target species. Therefore, this study analyzed the visual spectrum sensitivity and visual threshold of O. niloticus using LED based on previous studies for O. niloticus because the effective wavelength varies depending on the experimental conditions and target species. In addition, it was conducted to analyze the effect of the LED wavelengths on the behavior of O. niloticus by temperature to provide basic data for selecting appropriate LED lights when developing an indoor aquaculture system for O. niloticus.
Materials and Methods
O. niloticus (n = 10, weight [W] 16.6 ± 8.2 g, total length [TL] 93 ± 16.5 mm) were purchased from the private aquaculture farms and divided into two groups of five each to analyze the visual sensitivity and behavior response to the LED light and water temperature. The test fish were stabilized in an experimental tank, and the temperature was gradually increased by one degree to 21°C under natural photoperiod for 7 days of acclimatization before the experiment. The test fish were fed commercial feed (Suhyup Feed, protein 52%; ash < 14%; fat 11 %; calcium 1.5%; fiber < 3%; phosphorus < 2.5%), with a proportion of approximately 0.2% of fish weight once a day.
Twelve single LED lights (L5.0 × W5.0 × height [H] 1.5 mm) were mounted in a three-by-four matrix on an epoxy board (L80 × W80 × H1.5 mm). Each LED light had a different peak wavelength, ranging from 405 to 660 nm (Fig. 1 and Table 1). The epoxy board was installed approximately 17 cm above the eyeball of the test fish, such that the light emitted from the LED package could be sufficiently reflected on the entire pupil of the test fish.
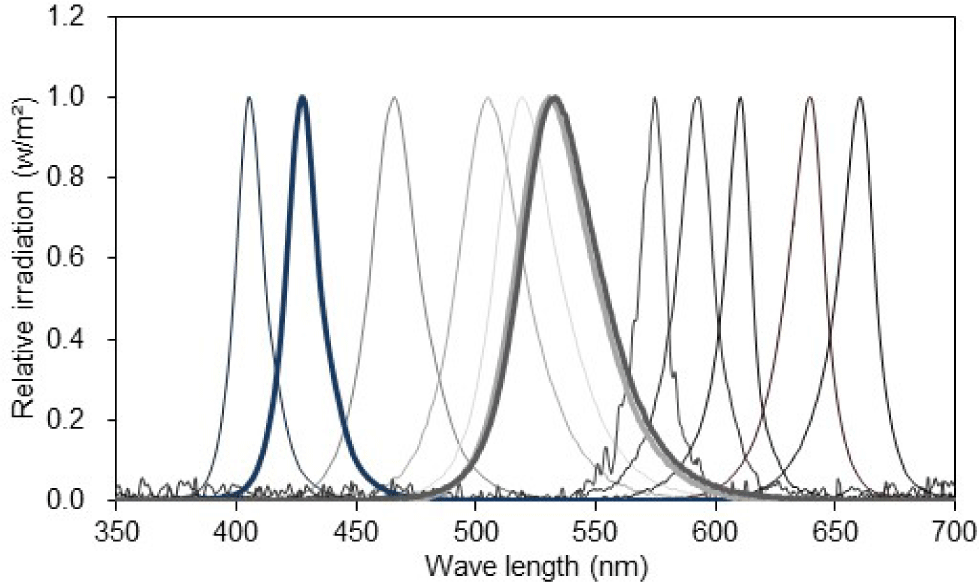
The light intensity was adjusted by connecting eight fixed resistors of different resistance sizes in series to control the current supplied to the light source (Table 2). The current from R1 to R8 was time-switched for automatic light intensity control using a programmable logic controller (K7M-DR20U, LS Electric, Anyang, Korea) (Fig. 2).
| Number | R1 | R2 | R3 | R4 | R5 | R6 | R7 | R8 |
|---|---|---|---|---|---|---|---|---|
| Resistance (kΏ) | 59.2 | 50.0 | 44.0 | 33.0 | 25.0 | 16.6 | 8.2 | 3.3 |
Five test fish (W14.5 ± 6.0 g, TL87 ± 13 mm) were dark-adapted for 2 hours in a bucket containing 2.5 L of freshwater and immobilized with an intramuscular injection of gallamine triethiodide (0.38 mg/10 mL, Ringer’s solution). Muscle-immobilized fish were placed in a Faraday cage and allowed to dark-adapt for 30 minutes. The test fish were artificially ventilated during electroretinogram (ERG) recordings by pumping aerated freshwater (20°C) over the gills to keep them alive.
ERGs were recorded using two silver-wire electrodes (540800, A-M Systems, Sequim, WA, USA; Ø0.2 × L11 mm). The recording electrode was attached to the cornea, and the reference electrode was placed on the fish craniums. The ends of the electrodes were bent for attachment to the cornea to prevent wounds, and the recording and reference electrodes were fixed using a three-axis micromanipulator (MM3, Narishige Scientific Instrument Lab., Tokyo, Japan).
As the microbolt ERG signal was weak, it was amplified by approximately 25,000 times with a bioelectric amplifier (P400, PhysioLab, Busan, Korea). The amplified signals were transmitted simultaneously to a data logger (DA20, R10N, Tokyo, Japan) and a PC. The ERG data were analyzed after filtering with Labchart8 reader software (ADInstruments, Dunedin, New Zealand).
Spectral sensitivity peak wavelength was estimated from ERG data by the method of Stavenga et al. (1993) as the mean relative sensitivity data.
The behaviour of five test fish (W18.6 ± 10.3 g and TL99 ± 20 mm) were analyzed behavior under varying water temperatures and light colors utilizing a monitoring system.
In this study used red and green lights were used as stimuli. The wavelength and power of the lights were 622 nm and 811 mW in red and 518 nm and 810 mW in green, respectively. Before the test, acclimatization was performed for 2 days at 21°C–22°C under natural photoperiod (light [L]:dark [D], 12L:12D) in an experimental tank. For the control group, fish behavior was recorded under natural photoperiod (12L:12D) for 40 minutes daily for 17 days, and temperature was increased by 1°C per day. For the experimental groups, fish behavior was recorded under red and green lights for 40 minutes each for 7 days. The temperature was also increased by 1°C per day from 28°C to 34°C. The test fish were fed using the same method in the previous experiment.
The behavior of the test fish was recorded using a monitoring system consisting of four infrared cameras (CNB-D2000, CNB Technology, Seoul, Korea) and a real-time digital video recorder (H0441L, NADATEL, Seoul, Korea). The system recorded fish movements for one hour (40 min on-light and 20 min off-light stimuli). The recorded data were analyzed using an image analysis software (PV Studio 3D, version 2.3, LAB, Miyazaki, Japan).
This study conformed to the guidance of animal ethical treatment for the care and use of experimental animals. Test fish were used with the minimum number to obtain statistically valid results and to consider stocking density. In addition, the experiment time exposed to stimuli was minimized, and test fish were protected from external stimuli except lights. In order to minimize the use of gallamine treithiodide, the ERG was recorded as soon as possible after the first injection before the immobilization was released. After the experiment, the test fish were humanely euthanized and discarded according to Laboratory Animal Act (Act No. 18969, 10 Jun. 2022) (KLIC, 2023).
Results
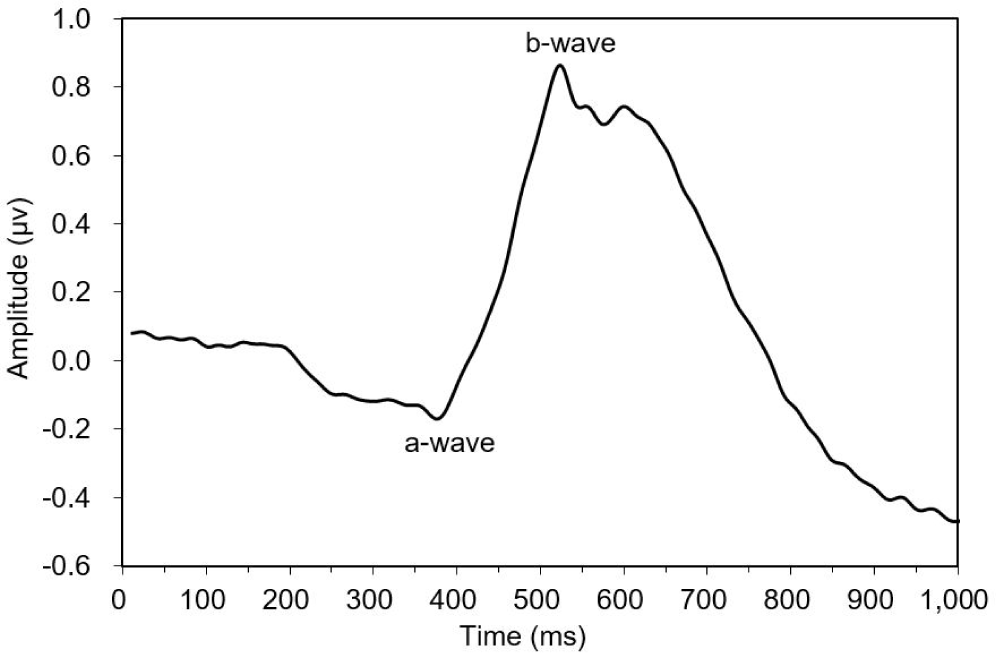
This study observed three of the four typical ERG bands (a, b, and d waves) in the dark-adapted test fish. The ERG started from an a-wave, followed by a b-wave, and lastly a d-wave (Fig. 3). The dominant wavebands obtained from the experiment were the a- and b-waves, which were used to measure the amplitude response of the fish to light of different wavelengths. Visual threshold refers to the minimum light intensity detected by the dark-adapted eye. The visual threshold of the test fish was inversely proportional to the LED wavelength. The visual threshold increased with decreasing wavelength. The test fish responded to the high light intensity at short wavelengths, whereas their response to the light intensity at long wavelengths was low. The minimum visual threshold revealed at 574 nm. In contrast, in the present study, all fish showed a high visual threshold at 660 nm. The standard deviation of irradiance was the greatest at 405 nm and the lowest at 505 nm (Fig. 4).
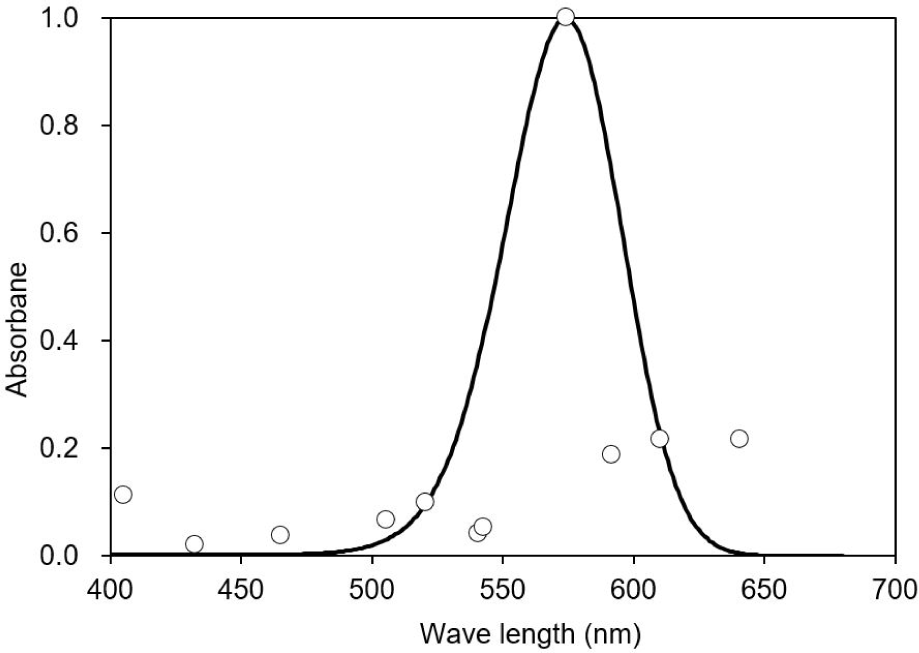
The peak spectral sensitivity was estimated at 574 nm, with the minimum sensitivity of 432 nm. A good fit was observed between the averaged spectral sensitivity data and the model (Pearson’s correlation, R2 = 0.8). In addition, a shift in the curve was observed to the longer wavelength of the light spectrum with the sensitivity curve ranging from 480 to 640 nm (Fig. 5).
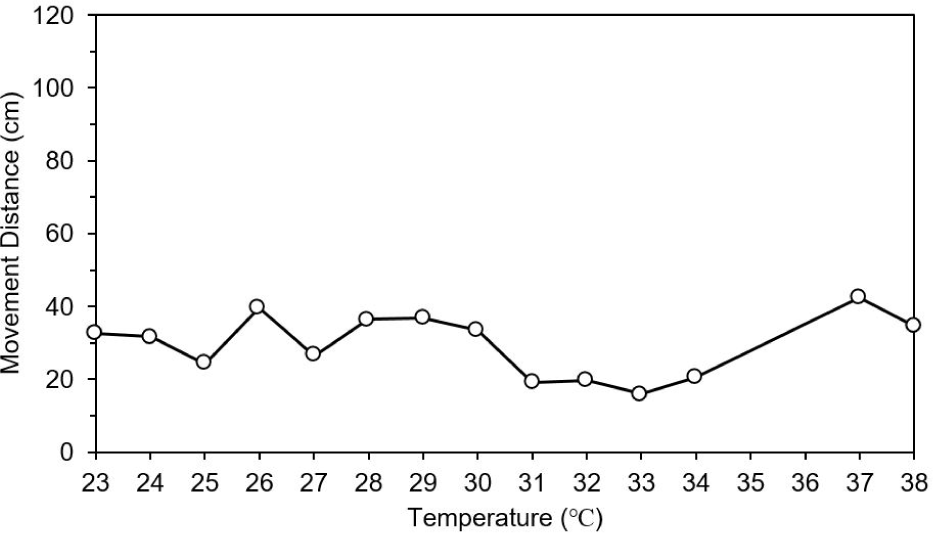
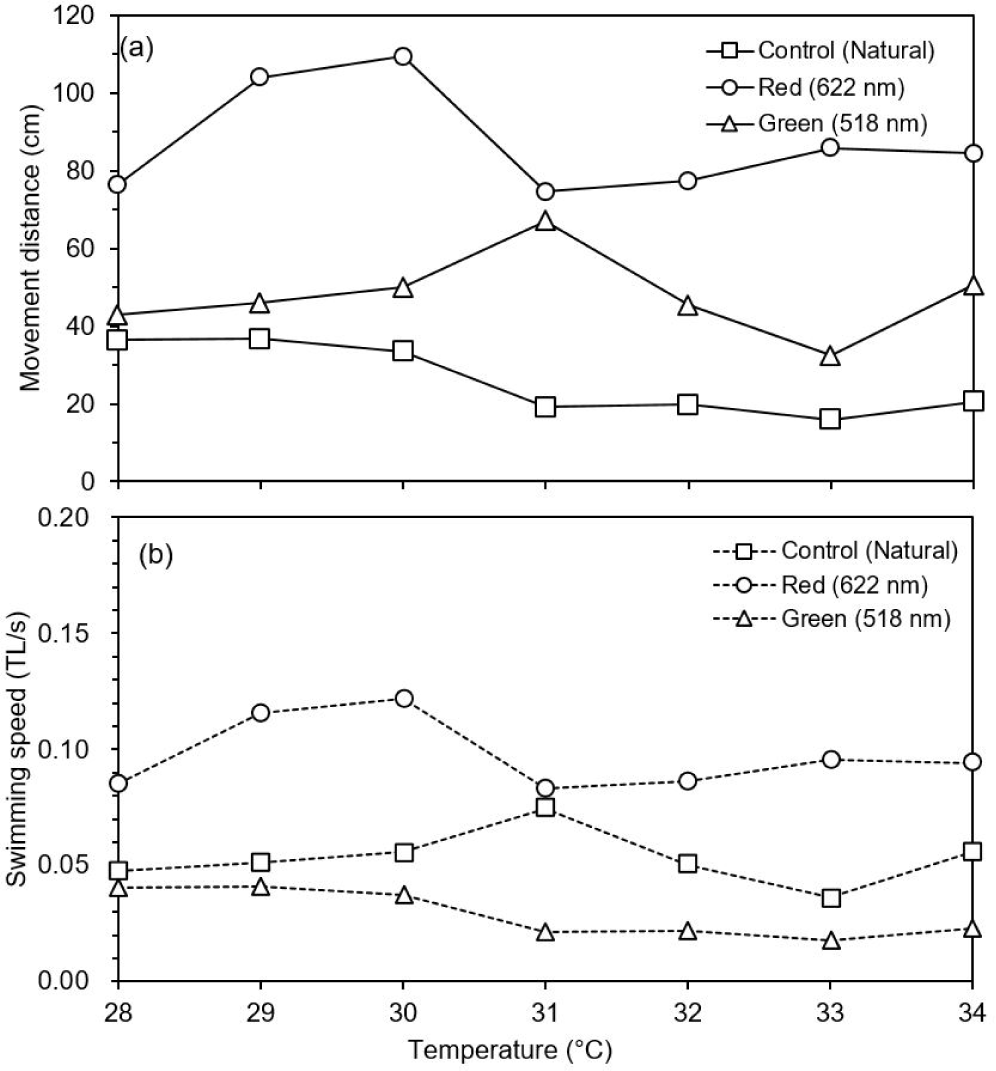
The movement distance and swimming speed were measured to determine the effect of changing water temperature and wavelength (red and green) on the behavior of the test fish. In the control group (natural light), there was no difference in movement distance by increase in water temperature. However, movement distance was dropped at 31°C and increased abnormally at 37°C under natural light (Fig. 6). When the water temperature reached 38°C, food intake was stopped (data not shown). Movement distance and speed was higher under red light than under green and natural lights (post-hoc Tukey’s test, mean = 61.5, SD = 6.0, p < 0.001). The test fish showed highest activity at 30°C under red light and at 31°C under green light. However, the movement distance decreased rapidly at 31°C under red light, and it was lowest at 33°C under green light. After that, there was a tendency to gradually adapt to high water temperature (Fig. 7).
Discussion
Fish behavior depends on several biological aspects, which includes the sensory organs, nervous system, and mechanisms that generate and control the resulting movements. Behavior also adapts to events occurring within the body, therefore, the physiological processes that control internal conditions also determine fish behaviors. Fish are constantly stimulated and responsive and can either provoke an immediate reaction. Fish behavior allows organisms to adjust to external and internal stimuli to survive in a changing environment. Behavior is a selective response that constantly adapts through direct interaction with the environment’s physical, chemical, social, and physiological aspects (Shrivastava et al., 2011). Some specific behaviors are well reported as indicators of stress and pain in fish, like feeding, agonistic interactions, swimming activity, or biting and at the stimulation site (Beitinger, 1990; Stoskopf, 1994). Holland et al. (1990) reported that fish activities are divided into relatively few distinct behavior patterns, set into motion by various environmental stimuli and oriented by light, currents, and water temperature gradients. Among environmental stimuli, temperature and light affect health, stress, feeding, reproduction, aggressive interactions, and growth in fish (Beitinger, 1990; Stoskopf, 1994; Villamizar et al., 2011). Visual cues are essential in various aspects of fish life. Three characteristics of light affect fish behavior and their ability to find objects in their environment. These properties include the quality of light (the light spectrum concerning wavelength), quantity of light (illuminance or light intensity), and photoperiod (ratio of light hours to dark hours during a 24 h period) (Jobling, 2012). In addition, fish respond to difference wavelengths of light depending on the species and developmental stages.
In this study, O. niloticus had a high sensitivity at 574 nm under LED lights. Matsumoto & Kawamura (2005) reported that O. niloticus responded to the green light (565 nm). The difference of peak wavelengths from these results may cause by light intensity. In this study, light intensity was a maximum 0.08 quanta/cm2∙s, while light intensity was 9.82 μmol/m2∙s (approximately 5.91 × 10¹⁴ quanta/cm2∙s) in previous research. Although different in light intensity, these results indicate that O. niloticus has visual sensitivity to green light of LED. However, visual sensitivity with a 250 W quartz-halogen lamp showed that adult O. niloticus had visual sensitivity between 600 to 800 nm (Lisney et al., 2010). It is difficult to compare these results because of difference in light sources and light intensity. However, O. niloticus has developed a heightened sensitivity to long wavelengths of light, which is well suited to the predominant light available in its natural habitat. Sabbah et al. (2012) reported that sensitivity between 400 and 700 nm with a 150 W xenon arc lamp did not vary by ontogenetic stage of O. niloticus. The sensitivity between 300 and 400 nm was, however, ontogenetic stage-dependent under different lights, and sensitivity of juveniles and adults was lower than that of fry. Therefore, O. niloticus has different visual sensitivity depending on the light source and light intensity even in the same wavelength range, and visual system of O. niloticus is highly adaptive, with a broad range of sensitivities, suggesting they can easily adjust to changes in their unpredictable environment (Lisney et al., 2010).
In this study, photoperiod was fixed as 12L:12D, and the effect of photoperiod on O. niloticus was not considered. Photoperiod is a major parameter to effect on growth, mortality, and behavior. For fry and fingerling of O. niloticus under a fluorescent lamp, fry showed high survival rate in 24L:0D, and high growth rate in 18L:6D, while fingerling had high rates of survival and growth in 24L:0D (El-Sayed & Kawanna, 2004). For adult O. niloticus under a fluorescent lamp, growth rate was high in 18L:6D. In addition, spawning performance of female broodstock was high in 12L:12D (El-Sayed & Kawanna, 2008). In the previous study where the water temperature and light intensity were fixed and the wavelength and photoperiod were set as variable parameters with a fluorescent lamp, growth rate of fry O. niloticus was high in 24L:0D under blue light (wavelength was not provided) (Elsbaay, 2013). Under 450–600 nm of LED light, growth rate of juvenile O. niloticus in 24L:0D and 18L:6D was higher than 12L:12D (Wang et al., 2023). Regarding the effect of light intensity on growth rate of O. niloticus, growth rate of juveniles did not increase by light intensity under 450–600 nm of LED light (Wang et al., 2023), while growth rate of fry under incandescent light bulbs (12L:12D) increased by light intensity (Martínez-Chávez et al., 2021). In addition, aggressive behavior was reduced when adult O. niloticus was exposed for 30-min from low light intensity under a fluorescent lamp (white) (Tatemoto & Serra, 2021). It has the advantage of high growth rate depending on lighting time and illumination, but appropriate combinations are required in consideration of investment and maintenance costs for aquaculture of O. niloticus.
Water temperature has a significant influence on aquatic organism’s biological activity and growth. Higher water temperature leads to greater biological activity of fish, insects, zooplankton, phytoplankton, and other aquatic animals. As water temperatures increase far above or below the preferred range, the mortality of aquatic species may increase. O. niloticus is a tropical species that prefers shallow waters. Water temperature in Uganda is gradually rising due to climate change in recent years. Comparing temperatures between 1991–2020 and 1901–1930 in Uganda, the observed average seasonal maximum temperature increased by 1.9°C. In December, January and February, the observed average seasonal maximum temperature was 3.5°C higher than before, which is more significant increase than other months (WBG, 2023). Therefore, it is necessary to develop aquaculture technology to adapt to climate change in O. niloticus’s aquaculture.
This study found no mortality from high temperatures and there was no significant difference in the swimming activity of O. niloticus by water temperatures under natural light (12L:12D). However, increased water temperature significantly reduced feeding activity (data not shown), which is expected to affect the growth performance of O. niloticus. Previous studies suggested 28°C–32°C as optimum temperature range for rearing fry and juvenile of O. niloticus (Azaza et al., 2008; El-Sayed & Kawanna, 2008; Mires, 1995; Pandit & Nakamura, 2010; Tine et al., 2022). In the studies on the effect of high temperature on growth of O. niloticus, it was found that the growth and survival rate of both adult and fry decreased at 34°C or higher (Islam et al., 2020). In particular, survival rate of fry decreased by more than 40% when the high temperature (37°C) lasted for more than 60 days (Pandit & Nakamuira, 2010). It was possible that juvenile O. niloticus survived for two weeks at 40°C (Ibáñez et al., 2019). Therefore, it will greatly affect aquaculture production of O. niloticus, if the high temperature above 34°C continues for a long time.
When adult O. niloticus was exposed to red (622 nm) and green (518 nm) of LED lights, swimming activity was higher under red and green than natural light. Swimming activity under red light was decreased at 31°C, whereas activity under green light was decreased at 32°C. Jin et al. (2019) found that adult responded to prey more often under red light (627 nm) of LED than other colored lights, and weight increased significantly in the order of red, green (513 nm) and blue (452 nm) lights. It was found that LED lights have a more positive effect on fish activity rather than natural light. Behavioral characteristics for light wavelengths (color) were similar in other light sources. For adult O. niloticus exposed to different wavelengths of florescent lamp, feed response behavior under red light (628 nm) was faster than under yellow (520 nm), green (516 nm) and blue (452 nm) lights, and feed intake was higher in order of red, green, yellow and blue lights (Volpato et al., 2013).
In this study, relationship between growth and wavelength was not considered. However, it was found that wavelength affected growth performance and metabolism of O. niloticus in the previous researches. Growth rate of fingerling O. niloticus was higher under red (627 nm) and green (513 nm) lights than under blue (452 nm) light of LED (Lopez-Betancur et al., 2020). For juvenile O. niloticus (genetically improved farmed tilapia [GIFT] strain), growth rate was higher under red light (625–630 nm) than under yellow (590–595 nm) and blue (450–455 nm) lights of LED, whereas stress response was highest under yellow light and lowest under blue light (Yi et al., 2022). However, weight gain of fingerlings was greater under blue light than under red and white light, although the difference in weight under fluorescent light was not significant (Elsbaay, 2013). Stress response of adult O. niloticus was lower under blue light than under green and yellow lights of fluorescent lamp (Maia & Volpato, 2013; Volpato & Barreto, 2001).
Consequently, red and green lights of LED may be recommended for O. niloticus’s aquaculture because the lights effect on growth and survival rate and swimming activity against heat stress positively in the previous studies and this study. In addition, green light of LED influenced biofloc composition positively (Lopez-Betancur et al., 2020). Although the high growth and survival rates were shown at 24L:0D, photoperiod is recommended at 18L:6D for cost efficiency because the difference between 24L:0D and 18L:6D was not significant. Considering that the average water temperature in Uganda is 20°C, it is unnecessary to consider cold tolerance of O. niloticus. However, it is necessary to control the water temperature below 32°C due to abnormal behavior at 32°C or higher and reduced feed intake and increased mortality at 37°C or higher. It is difficult to suggest an exact value for the light intensity because light position and measurement unit were different in each research. Thus, further research is necessary to assess appropriate light intensity and wavelength to improve resistance to heat stress for O. niloticus.


