Introduction
Temperature is considered one of the most important criteria in species selection for aquaculture. Temperature tolerance of fish varies with species, acclimation time, and magnitude of thermal exposure (Das et al., 2004). Understanding thermal acclimation and critical temperature are two important aspects in evaluating the thermal tolerance of fish (Díaz-Herrera et al., 1998). The critical thermal maxima (CTmax) is recognized as an effective indicator of thermal tolerance of an organism that allows identifying the first stress occurring temperature point (Beitinger et al., 2000). CTmax is the temperature for a given species, above which most individuals respond with unorganized locomotion, subjecting to likely death. The CTmax procedure is more preferable for working with the endangered or threatened species as it does not require sacrificing the fish as an endpoint (Lutterschmidt & Hutchison, 1997).
The critical thermal methodology is the most common method used to determine the CTmax of an aquatic organism. Cowles & Bogert (1944) first introduced this methodology and then used it by various researchers on fish or other aquatic animals (Beitinger et al., 2000; Lutterschmidt & Hutchison, 1997). Critical thermal methodology data provides a relative comparison of the thermal tolerance between fish species in extreme temperature. The reaction of the aquatic animals to temperature change is mathematically expressed by acclimation response ratio (ARR), which is also used in thermal tolerance studies (Díaz-Herrera et al., 1998). ARR is defined as the change of the CTmax value with per degree change in the acclimation temperature (Tacc).
The red-spotted grouper (Epinephelus akaara) is a subtropical species, which has a promising aquaculture value due to its high market demand in Korea, southern Japan, southern China, Hong Kong and Taiwan (Sadovy de Mitcheson et al., 2013). Currently, this species is being developed as an export item in Korea. The optimal growth temperature of the red-spotted grouper is reported to be 24°C–28°C (Lee & Baek, 2018). However, the seawater temperature is likely to be increased above 30°C in Korea during the summer season. The seawater temperature is exceeding beyond the normal tolerance range of fish due to the climate change effect (Noyes et al., 2009). The rising water temperature due to the climate change effect is anticipated to affect the productivity of red-spotted grouper in wild as well as in aquaculture conditions. Therefore, it is essential to determine the upper thermal tolerance limit of E. akaara in terms of CTmax.
CTmax provides helpful information on the ecology and distribution of aquatic animals (Bennett & Beitinger, 1997). Therefore, determining the CTmax level would be helpful to improve the management and conservation strategies of endangered species like red-spotted grouper (Deslauriers et al., 2016). The effects of Tacc on CTmax have been explored in many fish species (Beitinger et al., 2000; Currie et al., 1998; Yanar et al., 2019; Zhang & Kieffer, 2014). However, the thermal acclimation effect on E. akaara has so far not been studied. Therefore, the purpose of the present study was to assess the CTmax of red-spotted grouper under different Tacc.
Materials and Methods
The experimental fish were collected from Jeju National University, Korea and were gradually acclimated to 120L aquariums for 2 weeks at 24°C, 28°C, and 32°C water temperature. Temperatures of the tank were maintained by using a thermostat (OKE6422H, Sewon Oke, Pusan, Korea). Each aquarium had equal size and height (75 cm × 45 cm × 45 cm) and was equipped with a recirculating filtration system. Temperature, salinity, pH, and dissolved oxygen (DO) were monitored daily by using a multi-parameter (HI9829, Hanna Instrumentals, Woonsocket, RI, USA). During the acclimation period, salinity, pH, DO, and photoperiod was maintained at 33.67–33.81 psu, 7.89–7.97, and 5.62–6.96 mg/L, 12L : 12D, respectively. Fish were fed 2 times daily (09:00 and 18:00 h; 2% of body weight [BW]) and uneaten food was cleaned after 30 minutes of feeding. 10% of the water in each aquarium was changed daily with filtered clean seawater during the acclimation time. The total length (TL) and BW of fish were recorded individually from each acclimated groups before conducting the CTmax test (Table 1).
| Parameters | Temperature groups | ||
|---|---|---|---|
| 24°C | 28°C | 32°C | |
| Total length (TL, cm) | 10.23 ± 0.13 | 19.33 ± 0.54 | 18.81 ± 0.31 |
| Body weight (BW, g) | 14.80 ± 0.65 | 144.19 ± 8.25 | 128.16 ± 0.68 |
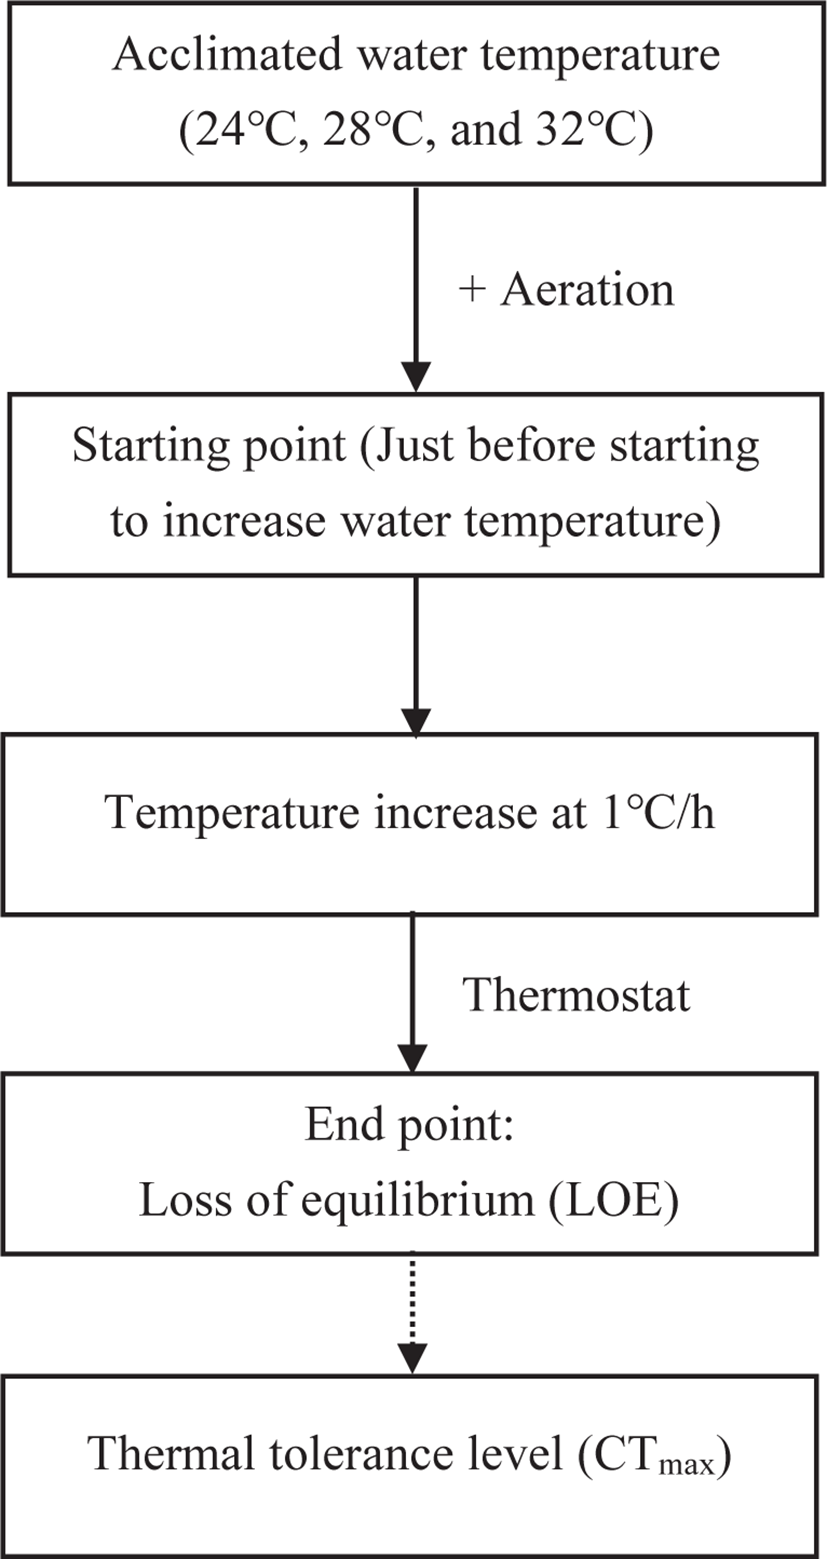
The fish were starved for 1 day before the CTmax test. 7 fish from each temperature group were randomly selected and determined the CTmax value individually. Thus, 21 individuals from three Tacc were used in this process. The CTmax levels were assessed following the critical thermal methodology described by Paladino et al. (1980). The temperature increase rate of 1°C/h was used as recommended by Wedemeyer & McLeay (1981). The individual fish from the designated adaptation temperatures (24°C, 28°C, and 32°C) were transferred into a 40L aquarium and subjected to thermal stress by using a thermostatically controlled aquarium heater. Water temperature was constantly increased (1°C /h) until loss of equilibrium (LOE) was reached (Fig. 1). LOE was designated as the endpoint used for the CTmax test, at which fish were first time unable to keep the position in dorsoventrally for 10 sec (Ziegeweid et al., 2008). The final temperature was recorded after reaching the LOE. The temperature was carefully monitored before and during the thermal test. During each test, the DO level was maintained above 6.5 mg/L in the test tank through continuous aeration. Fish were transferred to their respective Tacc immediately after the CTmax test and monitored for survival for the next 24 h. During the CTmax trial, changes in fish behavior (body movement, opercular movement, slime secretion, gasping, revolution along the axis, and LOE) were noted. The thermal tolerance period (TTp) of fish was also recorded during each test. The ARR was calculated according to Claussen (1977).
All data are presented as mean ± SEM. The significant differences between the means were analyzed with ANOVA (oneway analysis of variance) followed by Duncan’s multiple range test using SPSS statistics software (ver. 21.0; IBM, Armonk, NY, USA). Regression analysis was used to estimate the relationship between Tacc and other studied parameters. The significance level was set at p < 0.05.
Results
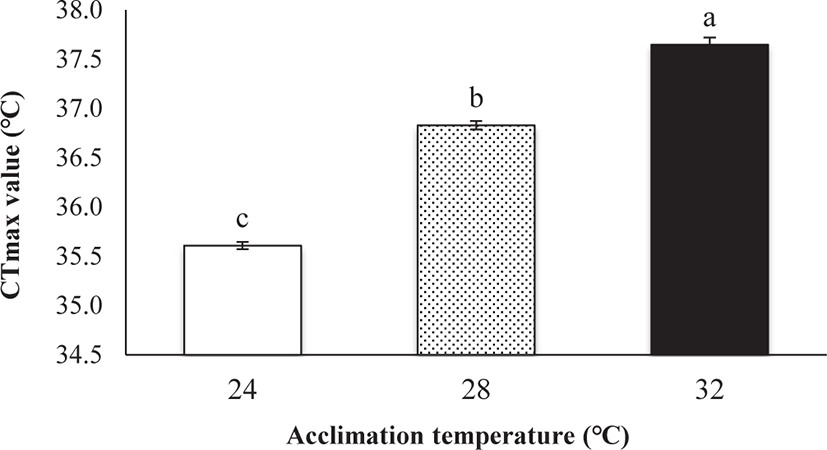
CTmax was significantly influenced by Tacc (ANOVA, p < 0.05; Fig. 2). A significant positive relationship was observed between CTmax and Tacc (R2 = 0.965, p < 0.01, CTmax = 29.55 + 0.26 Tacc). Fish acclimated to 24°C had the lowest CTmax (35.61°C) and fish acclimated to 32°C had the highest CTmax (37.65°C; Fig. 2). The ARR (ARR = ΔCTmax / Δ Tacc; Claussen, 1977) was 0.26 between 24°C and 32°C.
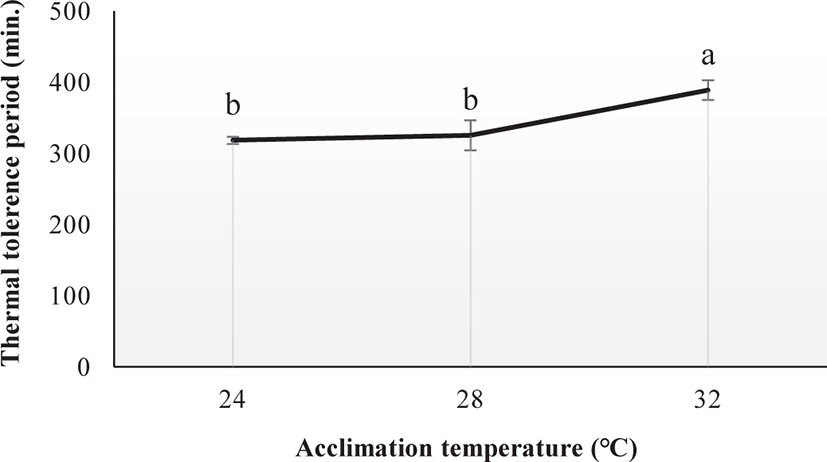
The thermal tolerance period was significantly affected by Tacc (ANOVA, p < 0.05; Fig. 3). Fish acclimated at 32°C had higher TTp (388.57 min) compared with those acclimated at 24°C (318.15 min) and 28°C (325.14 min).
Fish of the differently acclimatized groups (24°C, 28°C, and 32°C) showed extreme behavioral changes including rapid body movement, increased opercular movement, slime secretion, gasping, revolving along their axis, and finally LOE during the CTmax trial (Table 2).
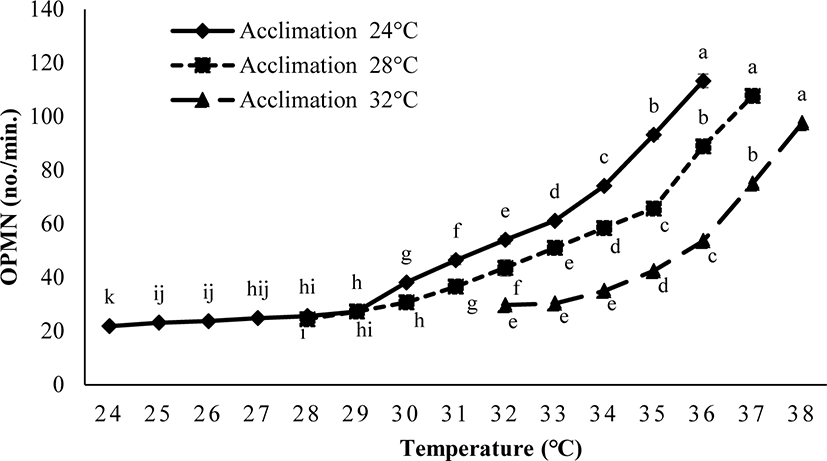
The operculum movement was significantly influenced by Tacc (ANOVA, p < 0.05). Fish acclimated to 24°C and 28°C had higher OPMN in comparison to the fish acclimated at 32°C (Fig. 4).
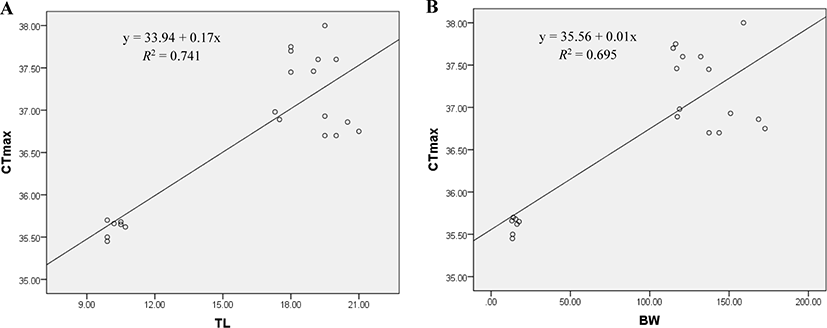
A significant positive relationship exists between CTmax and body size of red-spotted grouper. CTmax was found positively correlated with the TL (TL, R2 = 0.741; p < 0.01; Fig. 5A) and BW (BW, R2 = 0.695; p < 0.01; Fig. 5B) of E. akaara. The relationships are described by the equations, CTmax = 33.94 + 0.17TL and CTmax = 35.56 + 0.01BW.
Discussions
The CTmax test is the most relevant among the various studied approaches for determining the thermal tolerance of animals (Beitinger et al., 2000). CTmax provides an ecologically and physiologically valuable reference point that can signal an early sign of thermal stress (Stewart & Allen, 2014). The CTmax of E. akaara has not been determined. This is the first study that has examined the thermal tolerance, measured as CTmax in red-spotted grouper. The results of the present study showed that changes in Tacc can significantly affect the CTmax level of E. akaara.
The Tacc has been suggested to be the most important factor that affects the thermal tolerance of fish (Beitinger & Lutterschmidt, 2011). In addition to the Tacc, the thermal tolerance limits of fish are also influenced by a variety of factors like species (Das et al., 2004), size (Zhang & Kieffer, 2014), and condition factor (Baker & Heidinger, 1996). The relationship between CTmax and Tacc have been reported in many aquatic species (Akhtar et al., 2012; He et al., 2014; Yanar et al., 2019; Zhang & Kieffer 2014) as obtained in the present study for E. akaara. In this study, the highest CTmax value observed at 32°C Tacc compared with the 24°C and 28°C indicating that CTmax level increased significantly with increasing Tacc. The result of the present study confirms that fish’s prior thermal exposure history or Tacc largely affects the thermal tolerance limit of fish. Our result is in line with the findings of Cheng et al. (2013), who reported that the CTmax value of brown-marbled grouper (Epinephelus fuscoguttatus) was ranged from 35.90°C to 38.30°C under different Tacc. Besides, the CTmax values for the tropical bonefish (Albula vulpes) were reported to be 36.4°C and 37.9°C for fish acclimated at 27.3°C and 30.2°C, respectively (Murchie et al., 2011). The CTmax values in different Tacc were also observed in many other fish species including shortnose sturgeons (Acipenser brevirostrum) (Zhang & Kieffer, 2014), climbing perch (Anabas testudineus) (Sarma et al., 2010), and carp (Cyprinus carpio) (Chatterjee et al., 2004).
The Tacc exerts a major effect on thermal tolerance showing a strong linear correlation with CTmax (Beitinger et al., 2000). In this study, the linear regression slope indicates that, for each 1°C Tacc, the CTmax of E. akaara increased by 0.26°C. This indicates a gain in thermal tolerance (CTmax) with an increase in Tacc. However, this is fairly smaller than the previously studied shortnose sturgeons (A. brevirostrum), where CTmax increment rate was 0.52°C for each 1°C Tacc (Zhang & Kieffer, 2014). This may be due to the regional difference as E. akaara is a subtropical species and A. brevirostrum is a cold-water species.
The ARR indicates the physiological response of aquatic organisms to the temperature change (Díaz et al., 2002). In the present study, the ARR values of E. akaara was 0.26. Similar ARR values have been reported in many warm water fishes such as 0.36°C for Pelteobagrus vachelli (Wang, 2009), 0.40°C for channel catfish (Ictalurus punctatus) and 0.32°C for large mouthbass (Micropterus salmoides) (Currie et al., 1998). However, the present study had smaller ARR value in comparison with the shortnose sturgeons (A. brevirostrum) (Zhang & Kieffer, 2014). The ARR values are dependent on the geographic zone where the organisms dwell (Díaz et al., 2002).
In this experiment, the TTp of E. akaara was significantly affected by Tacc. The fish acclimated at high temperature may have a higher TTp. Zhang & Kieffer (2014) reported a similar variation in the TTp of shortnose sturgeons (A. brevirostrum). In our study, the differently acclimated fish (24°C, 28°C, and 32°C) exhibited behavioral changes including extreme mobility, increased operculum activity, mucus secretion, gulping for air, revolution along the axis, and finally loss of balance after reaching their respective CTmax level. Our results are consistent with those of Cheng et al. (2013), who observed similar behavioral changes in the differently acclimated brown-marbled grouper, E. fuscoguttatus (20°C, 26°C, and 32°C) during the CTmax test. Counting the operculum movement rate is a way to calculate the respiration rates. In this study, the increased operculum movement (OPMN) observed in fish acclimated to 24°C and 28°C indicates a higher respiratory frequency compared to fish acclimated at 32°C. Seol et al. (2008) reported a similar variation in opercular activity in Far Eastern catfish, Silurus asotus after exposed to different acclimatized temperatures (20°C, 25°C, and 30°C). In our study, the body size of E. akaara was found to be correlated with the CTmax value. A similar result was observed in shortnose sturgeons (A. brevirostrum) by Zhang & Kieffer (2014). CTmax level increases with fish size because larger fish have a lower surface area to volume ratios, which causes a longer period to penetrate the heat into the fish’s body (Ziegeweid et al., 2008).
Conclusion
Collectively, it is said that the CTmax value of red-spotted grouper can be affected by different adaptation temperature (24°C, 28°C, and 32°C) and the fish acclimated to a higher temperature has a higher CTmax level. Besides, the obtained CTmax value of 35.61°C–37.65°C indicating the upper thermal tolerance limit for E. akaara under different Tacc (24°C, 28°C, and 32°C). Understanding the critical thermal tolerance limit of E. akaara is of ecological significance in the conservation of this species.
