Introduction
Ammonia is ubiquitous in aquatic environments because it is created by feed residuals, fertilizers, and animal excretions. Ammonia levels in aquatic environments can be increased by sewage effluents, industrial wastes, agricultural run-off, and decomposition of biological wastes, as well as high-density aquaculture. High ammonia concentrations have adverse effects on aquatic organisms, such as reduced growth rate, loss of equilibrium, disruption of ion balance, gill hyperplasia, hyperexcitability, coma, and convulsions (Li et al., 2013; Pan et al., 2011). In aquatic environments, ammonia exists in two chemical forms: an ionized form (NH4+) and an un-ionized form (NH3) (Kim et al., 2015). Of the two chemical forms, NH3 is more toxic to aquatic organisms than NH4+ because NH3 can cross the phospholipids of biological membranes (Miron et al., 2008). The permeation of ammonia can trigger oxidative stress, such as a redox imbalance or DNA damage, in aquatic organisms due to an increase in reactive oxygen species (ROS), including singlet oxygen, nitric oxide, hydrogen peroxide (H2O2), and superoxide radicals (Cheng et al., 2015). Many studies have reported that ammonia exposure stimulates the overactivation of N-methyl-d-aspartate glutamate receptors in the brain and neurons, which leads to an overproduction of ROS (Li et al., 2016; Zhang et al., 2018). In addition, excess ROS generation can also damage the respiratory chain of the mitochondrial membrane while increasing the calcium concentration, which in turn induces apoptosis (Zhang et al., 2020). Aquatic organisms have antioxidant enzymes to cope with excess ROS, such as superoxide dismutase (SOD) and catalase (CAT). SOD converts superoxide anion radicals into hydrogen peroxide and oxygen. CAT then decomposes hydrogen peroxide into water and molecular oxygen (Zhang et al., 2020). These antioxidant enzymes protect cells from ROS and maintain redox balance. Therefore, antioxidant responses can be an indicator of the oxidative stress induced by ammonia exposure (Kim et al., 2017).
The immune system of invertebrates can change in response to various changes in environmental conditions, such as temperature, salinity, pH, ammonia, and pollutants (Jiang et al., 2004). Exposure to a high concentration of ammonia is considered to be toxic and can lead to changes in the immune responses of invertebrates, such as phenoloxidase (PO) and lysozyme (LZM). PO is an enzyme involved in the innate immune defense system of invertebrates that plays a role in coagulation, phagocytosis, nodule formation, encapsulation, and antimicrobial peptide synthesis (Chen et al., 2012). PO, a copper-containing enzyme, is an important component of the pro-PO activating reaction cascade, which catalyzes the hydroxylation of monophenols to o-diphenols and the oxidation of odiphenols to o-quinones (Le Clec’h et al., 2016; Yao et al., 2019). In addition to PO, LZM is ubiquitous in hemolymph tissues and secretions and plays an important role in invertebrate immunity by hydrolyzing the 1,4-β-linkages of bacterial cell walls (Bachali et al., 2002; Ding et al., 2011; Nam et al., 2020). Therefore, both PO and LZM activity in invertebrates can be used as indicators of immune status by ammonia exposure.
Abalones, a type of marine gastropod, are widely considered a nutritive seafood resource for humans with antioxidant, anti-inflammatory, and anti-cancer effects (Min et al., 2015; Nam et al., 2020; Wickramanayake et al., 2020). The abundance of abalone fisheries globally has declined since the 1970s, whereas abalone aquaculture has been increasing over the past few years, constituting 95% of abalone production in the world (Cook, 2014; Wickramanayake et al., 2020). As production increases, the reliance on high-protein feed and high-density aquaculture increases; as a result, ammonia may accumulate in the culture water, subjecting abalones to problems related to ammonia toxicity (Naylor et al., 2014). Of the abalone species, Haliotis discus hannai is considered an important species in the Korean shellfish industry because it is highly marketable and commercially valuable. However, there is a lack of research concerning the potentially toxic effects of ammonia on H. discus hannai, despite the likelihood of elevated ammonia exposure. Therefore, the present study aimed to investigate the toxic effects of ammonia on the survival rate, growth performance, and antioxidant (SOD and CAT) and immunity responses (PO and LZM activity) in H. discus hannai.
Materials and Methods
Juvenile H. discus hannai individuals were obtained from an abalone farm in Jeju Island, Korea. Three hundred H. discus hannai were acclimatized to a 500 L cylindrical tank under laboratory conditions for one week (Table 1) and were supplied Undaria pinnatifida as the major diet. The tank was provided with a constant flow of water and maintained under 24 h dark conditions. After acclimation, fifteen healthy H. discus hannai (mean shell length 70.2 ± 4.9 mm; mean body weight 36.9 ± 3.6 g) were randomly selected from the acclimation tank and were divided into six groups. Each group was sorted into a 150 L cylindrical tank. Ammonia chloride (NH4Cl) (Sigma-Aldrich, St. Louis, MO, USA) solution was dissolved in each tank in the following ammonia concentrations: 0, 0.1, 0.2, 0.4, 0.8, and 1.6 mg/L. The actual ammonia concentrations are compared with the waterborne ammonia concentrations in Table 2. During the experimental period, water temperature and pH were continuously measured and maintained at 18 ± 0.5°C and 8.1 ± 0.2, respectively. When the water in each tank was renewed once daily, the pH and ammonia concentration were adjusted using a pH meter (Model 9625, Horiba, Kyoto, Japan) and adding NH4Cl solution, respectively. The water was continuously aerated using an air pump. A sufficient amount of U. pinnatifida was supplied daily, and the remaining U. pinnatifida were removed at the time of water renewal.
| Item | Value |
|---|---|
| Temperature (°C) | 18.0 ± 0.5 |
| Salinity (‰) | 33.2 ± 0.5 |
| pH | 8.1 ± 0.2 |
| Dissolved oxygen (mg/L) | 7.2 ± 0.2 |
| Chemical oxygen demand (mg/L) | 1.18 ± 0.2 |
| Waterborne ammonia concentrations (mg/L) | 0.0 | 0.1 | 0.2 | 0.4 | 0.8 | 1.6 |
| Actual ammonia concentrations (mg/L) | 0.02 | 0.13 | 0.24 | 0.42 | 0.83 | 1.64 |
The total exposure duration was four weeks, and the experiments were conducted at two and four weeks. Six experimental individuals were selected from each tank and anesthetized in buffered 3-aminobenzoic acid ethyl ester ethanesulfonate (Sigma-Aldrich). The H. discus hannai were maintained under a protocol approved by the Institutional Animal Care and Use Committee of Pukyong National University.
To determine the survival rates, the H. discus hannai were transferred into each tank, which were adjusted to contain ammonia concentrations of 0, 0.1, 0.2, 0.4, 0.8, and 1.6 mg/L in advance. During the four weeks, dead and non-adhesive individuals were eliminated from each tank, and the number of surviving and sticking individuals was recorded. To identify the non-adhesive individuals, we carefully pushed the H. discus hannai using a glass rod, and those that moved were considered non-adhesive. The survival rate analysis was performed using the Kaplan-Meier survival method and log-rank test.
A, Number of surviving individuals attached to the substrate
B, Number of all individuals participating in the experiment
In two-week intervals, the growth performance of the H. discus hannai was determined by measuring the specific growth rate (SGR) and DISL (μm/day). The calculations were done according to the following formulas:
Hepatopancreas and gill tissues were used to analyze the antioxidant response. Each tissue was excised and homogenized with 10 volumes of ice-cold homogenization buffer using a Teflon-glass homogenizer (099CK4424, Glass-Col, Darmstadt, Germany). The homogenate was centrifuged at 10,000×g for 30 min at 4°C, and the supernatants were extracted. After supernatant extraction, the samples were stored at −70°C until the antioxidant response analysis. SOD activity was measured using the SOD Assay kit (Dojindo Molecular Technologies, Rockville, MD, USA) with a 50% inhibitor rate for the reduction reaction of WST-1. SOD was defined as the amount of the enzyme in 20 μL of sample solution that inhibits the reduction reaction of WST-1 with superoxide anions. CAT activity was measured using hydrogen peroxide as a substrate, and the absorbance was decreased by reducing hydrogen peroxide at a wavelength of 240 nm using a spectrophotometer. The unit of CAT activity was expressed as nmol by reducing hydrogen peroxide by reacting 1 mg of protein per min. The protein content was measured using a BioRad kit (BioRad, Herculanes, CA, USA) using the Bradford method and measured at 540 nm on a spectrophotometer using bovine serum albumin (BSA) as a standard protein.
The hemolymph was collected from the hemolymph sinus with an EDTA (50 mM EDTA in PBS, pH 7.6)-treated syringe to prevent entanglement of the hemocytes. The supernatant was then centrifuged (Mikro 22R, Hettich Zentrifugen, Tuttlingen, Germany) at 1,200 rpm at 4°C for 10 min and stored at −70°C until the immune response analysis. PO and LZM activity were analyzed using hemolymph enzyme. PO activity was determined according to the methods described by Asokan et al. (1997). In brief, 2 mM L-DOPA was added to 0.1 M phosphate buffer (pH 6.0) and mixed with the sample. The absorbance was measured at 490 nm for 10 min, and the change of 0.001 in 1 min was defined as the absorbance value (unit / (min · mg protein)). LZM activity was measured using Micrococcus lysodeikticus (0.3 mg/mL, 0.05 PBS buffer, pH 6.0; Sigma-Aldrich), which was previously used as a substrate in the method described by Hutchinson & Manning (1996). The standard curve was constructed using hen-egg white lysozyme (Sigma-Aldrich), the absorbance change was measured at 450 nm for 10 min, and the active unit of lysozyme was expressed as unit/(min · mg protein).
Statistical analyses were performed using the SPSS 12.0/PC + statistical package (SPSS, Chicago, IL, USA). Significant differences between the groups were confirmed using one-way ANOVA and Duncan’s multiple comparison test or Student’s t-test (Duncan, 1955) for both groups. The significance level of the statistical results was set at p < 0.05.
Results
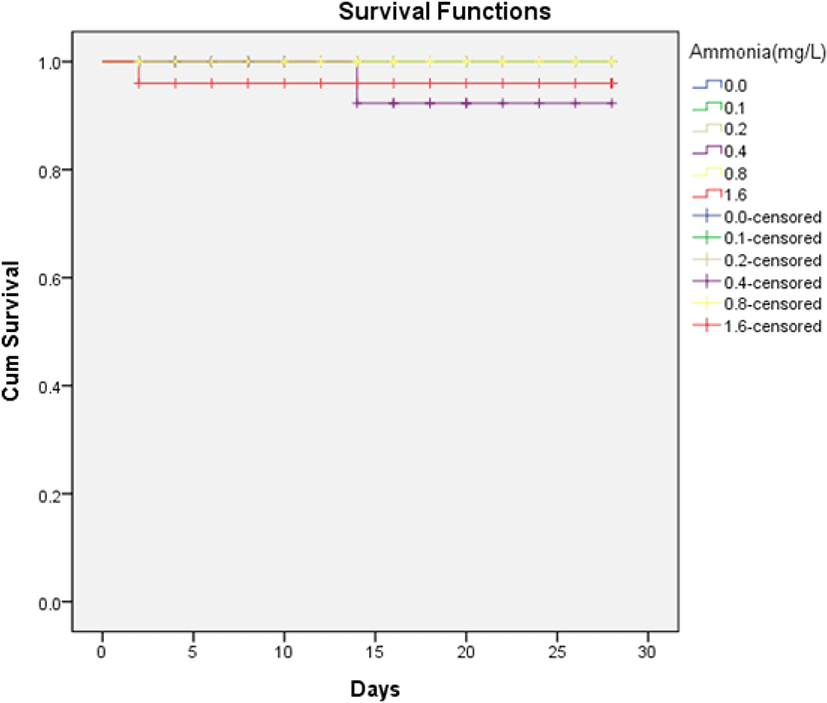
The survival rates of H. discus hannai are shown in Fig. 1. There was no death of H. discus hannai in ammonia concentrations below 0.8 mg/L during the four weeks of the study. Survival rates above 95% were observed for all ammonia concentrations, but there was no significant difference in the log-rank test (Mantel-Cox), as the p-value was greater than 0.05.
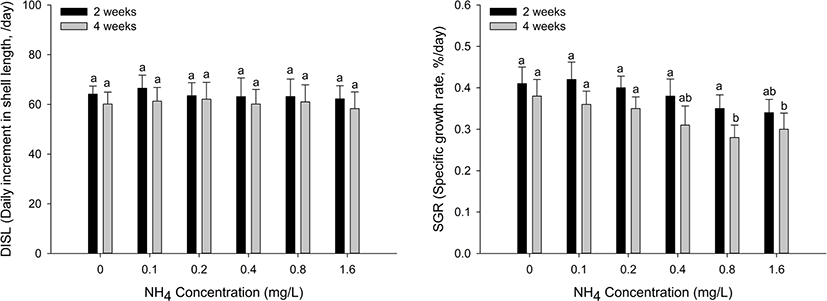
The growth performance of the H. discus hannai is shown in Fig. 2. The SGR significantly decreased at ammonia concentrations of 0.8 mg/L and 1.6 mg/L during the four weeks (p < 0.05). Conversely, there was no significant change in the DISL at all ammonia concentrations.
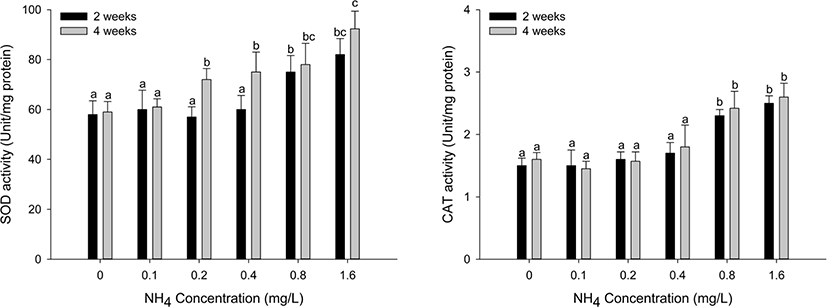
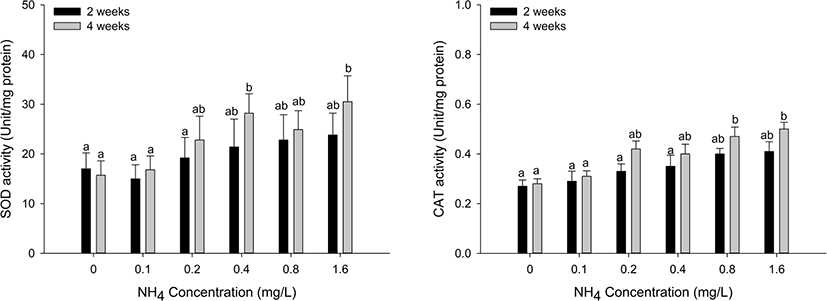
Antioxidant responses (SOD and CAT) in the hepatopancreas and gill tissues of H. discus hannai are shown in Figs. 3 and 4. The SOD activity of hepatopancreas tissues was significantly increased at ammonia concentrations over 0.8 mg/L at two weeks and over 0.2 mg/L at four weeks (p < 0.05). CAT activity in the hepatopancreas showed a significant increase at ammonia concentrations above 0.8 mg/L at two and four weeks (p < 0.05). SOD activity of gill tissues was significantly increased at the 0.4 mg/L and 1.6 mg/L ammonia concentrations at four weeks (p < 0.05). CAT activity of gill tissues significantly increased at ammonia concentrations over 0.8 mg/L at four weeks (p < 0.05).
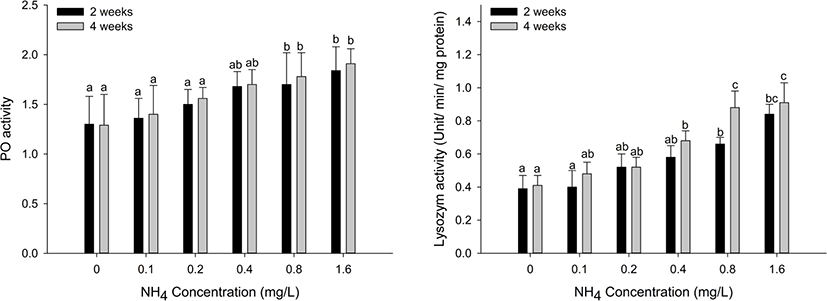
Immune responses (PO and LZM) in the hemolymph tissues of H. discus hannai are shown in Fig. 5. PO activity was significantly increased at ammonia concentrations over 0.8 mg/L at two and four weeks (p < 0.05). LZM activity significantly increased at ammonia concentrations over 0.8 mg/L at two weeks and over 0.4 mg/L at four weeks (p < 0.05).
Discussion
Ammonia exists in aquatic environments, though an appropriate concentration must be maintained to support living organisms. In high-density aquafarms, the ammonia concentration is generally much higher than that in the natural environment. The alteration of environmental conditions can cause toxicity and induce changes in growth rate, physiological functions, and antioxidant and immune responses (Kim et al., 2019; Morash and Alter, 2016). Ammonia exposure has an adverse effect on the growth performance of abalones by decreasing food consumption and increasing oxygen consumption (Cheng et al., 2004; Harris et al., 1998). Chronic ammonia exposure causes a low growth rate and, consequently, death in abalones (Huchette et al., 2003). Therefore, it is important to maintain ammonia concentrations below toxic levels to ensure the optimal growth of abalones (Reddy-Lopata et al., 2006). In our biweekly measurements, SGR was significantly decreased at ammonia concentrations over 0.8 mg/L in H. discus hannai, which was consistent with the influence of ammonia exposure.
Aquatic organisms have antioxidant defense systems to protect themselves from oxidative stress by maintaining the balance between ROS production and antioxidant defense (Cheng et al., 2015). In the antioxidant defense system, SOD converts ROS into oxygen and hydrogen peroxide, and CAT catalyzes the conversion of hydrogen peroxide into water and oxygen. Both SOD and CAT play important roles in maintaining the antioxidant balance by eliminating ROS. These changes in antioxidant enzyme activities can be used as biomarkers of environmental stress (Hegazi et al., 2010). Exposure to ammonia is considered an environmental stress on aquatic organisms because exposure to ammonia can increase the production of ROS. In general, under normal conditions, ROS can be eliminated quickly by antioxidant enzymes; however, under high concentrations of ammonia, large amounts of ROS cannot be eliminated immediately, which causes an imbalance between ROS and antioxidant enzymes (Zhang et al., 2020). Liang et al. (2016) reported that SOD activity in the hepatopancreas of Litopenaeus vannamei exposed to ammonia was significantly decreased, indicating that excessive ROS induced the inhibition of antioxidant enzymes and lost a compensatory mechanism due to excessive ROS. By contrast, Hegazi et al. (2010) reported that the activities of SOD and CAT in the liver and muscle were significantly increased in Oreochromis niloticus exposed to ammonia. Kim et al. (2019) reported that SOD and CAT levels in the liver and kidney of Parlichthys olivaceus exposed to ammonia were significantly increased. In addition, Kim et al. (2015) reported that SOD and CAT in the liver of Sebastes schlegelii exposed to ammonia significantly increased biweekly over four weeks. The authors argued that the increase in antioxidant enzyme activity was a defense mechanism for reducing excessive ROS. In our comprehensive results, both SOD and CAT in the hepatopancreas and gills of H. discus hannai were significantly increased after 0.8 mg/L ammonia exposure. We speculate that the increase in both SOD and CAT activity appears to be an adaptive response to remove excess ROS production during the ammonia exposure period.
Innate immune responses in abalones are more important than adaptive immune responses due to the absence of an adaptive immune system (Bathige et al., 2014; Jiang et al., 2013). PO activity in the hemolymph is considered the main component of the invertebrate immune system and is used to assess the impact of environmental stressors on the invertebrate immune system (Chen et al., 2005; Cui et al., 2017). Many studies have investigated the PO activity of invertebrates exposed to ammonia as an immune parameter. Cheng et al. (2004) reported that the PO activity of H. diversciolor supertexta was significantly decreased at 1.08, 3.16, 5.37, and 10.34 mg/L ammonia. The PO activity of L. vannamei exposed to ammonia was significantly decreased (Chen et al., 2012; Cui et al., 2017; Liu and Chen, 2004; Zhang et al., 2018), although it increased gradually as the ammonia concentration increased (Lingxu et al., 2004). In our study, the PO activity in H. discus hannai exposed to 0.8 and 1.6 mg/L ammonia was significantly increased at two and four weeks. It seems that the PO activity in invertebrates exposed to ammonia varies with different factors, including environmental conditions, invertebrate species, exposure concentration, and time. In addition to PO activity, LZM activity contributes to invertebrate innate immunity against bacterial invasion and is known to exist in the hemolymph, gills, mantles, and digestive organs (Ding et al., 2011). Duan et al. (2017) reported that the LZM activity of L. vannamei was significantly increased under ammonia stress. Qin et al. (2019) also observed that ammonia exposure induced a significant increase in LZM in Eriocheir sinensis. By contrast, Yue et al. (2010) reported that ammonia exposure reduced lysozyme mRNA expression levels in Portunus trituberculatus, which inhibited immune responses against disease outbreaks. Toxicants can stimulate or inhibit immune responses by responding to the toxicants (Kim et al., 2017). Our results showed that ammonia exposure over 0.8 mg/L induced a significant increase in LZM activity in H. discus hannai, which seemed to be the result of a response to ammonia toxicants.
Given the results of our study, ammonia concentrations greater than 0.8 mg/L acted as an environmental stressor to H. discus hannai, resulting in significant alterations in growth performance (SGR), antioxidant responses (SOD and CAT), and immune responses (PO and LZM activity) but not survival rate. Although the toxicity of ammonia on aquatic animals has been researched for a long time, there is insufficient research on the toxic effects of ammonia on H. discus hannai. The data obtained in this study can be used to evaluate the effects of ammonia toxicity on H. discus hannai.
