Background
Tilapia culture has been practised in more than 100 countries around the globe, yet most tilapia farmers, farm owners, farm managers, researchers, and graduate students in developing countries have little or lack accurate and critical information on tilapia culture (Abdel-Fattah, 2006). Lack of information on the basic requirements of an effective aquaculture system by small-scale fish farmers has handicapped the orderly, rapid development and high yield of the aquaculture industry in developing countries (Machena and Moehl, 2001). While the Sub-Saharan Africa region has numerous attributes such as underutilized land and water resources, cheap labor, high demand for fish and a favorable climate all year round, aquaculture production is still not at its maximum (Machena and Moehl, 2001). Optimal production of fish in culture systems has frequently been curtailed by several factors among them limited information on aquaculture set-up and poor information on pond water quality requirements for optimal fish production (Machena and Moehl, 2001).
Growth of fish is dependent on a wide range of positive or negative impacting factors. Studies show that growth of fish in aquaculture mainly depends on feed consumption and quality (Slawski et al., 2011); stocking density (Ma et al., 2006); biotic factors such as sex and age (Imsland and Jonassen, 2003); genetic variance; and abiotic factors such as water chemistry, temperature (Imsland et al., 2007), photoperiod (Imsland and Jonassen, 2003), and oxygen level (Bhatnagar and Devi, 2013). Therefore, successful management of fish ponds requires an understanding of water quality, which is determined by abiotic factors such as temperature, dissolved oxygen (DO), transparency, turbidity, water color, carbon dioxide, pH, alkalinity, hardness, unionized ammonia, nitrite, nitrate, primary productivity, biological oxygen demand (BOD), plankton population among others (Bhatnagar and Devi, 2013). A study by Bryan et al. (2011) conducted in Pennsylvania in 1998 on 557 pond owners established that 10% of the respondents had experienced water quality problems in their ponds ranging from muddy water to toxicity leading to fish kills.
Concerns about pond water quality are directly related to its production and therefore water quality parameters of greatest concern to fish farming are important to consider in fish culture (Bryan et al., 2011). Therefore, when evaluating and selecting sites for earthen fish pond siting, the source of water and its quality are some of the main factors to consider while ensuring that the water source has a high concentration of dissolved oxygen and optimal temperatures which should be kept at the right levels throughout the culture period among other critical factors (Ngugi et al., 2007).
Studies show that a special set of water chemistry requirements, and optimal water quality is essential to a healthy, balanced, and functioning aquaculture system (DeLong et al.,2009). The growth of different fish species is also influenced by a different range of factors, among them water quality parameters. Fish growth is generally greater in ponds with optimal levels of DO, temperature among other parameters (Bartholomew, 2010), though different fish species have ideal levels of water quality parameters within which they grow optimally (Kausar and Salim, 2006). Nile tilapia (Oreochromis niloticus) is ideal for culture due to its high growth rates, adaptability to a wide range of environmental conditions, ability to grow and reproduce in captivity and ability to feed at low trophic levels (Abdel-Fattah, 2006). The most preferred temperature range for optimal growth of tilapia is 25 to 27 °C, while the ideal pH ranges between 6 and 9 (DeWalle et al.,2011).
In 2009, the government of Kenya through the ministry of fisheries development introduced Fish Farming Enterprise & Productivity Programme (FFE & PP) in 140 constituencies across the country. The principal aim was to enhance food security, generate income among the rural community and stimulate rural enterprise development. In Teso North Sub-County, where the current study focused, 100 farmers benefited from the program at the time. Despite having been sensitized and supplied with adequate nutritious supplementary fish feeds and other crucial inputs essential for aquaculture, fish farmers in the selected constituencies still realized low yields from the semi-intensive aquaculture system. According to Ngugi et al. (2007), the expected yields from each pond at the stocking density of 3 fish/m2 for the mono-sex tilapia was 240 kg (8000 kg/ha/year).
However, 99 FFE & PP ponds out of the 100 ponds within Teso North Sub-County recorded harvests below 150 kg with the lowest recording as low as 70 kg, while the highest recorded 200 kg. Some of the reasons attributed to low production include the quality of water that was reportedly not taken into consideration during the initial set-up stages (Abdel-Fattah, 2006). Such vital knowledge alongside other important information on culture conditions of the pond water, fish feeds, growth rates, stocking density, and expected yields was missing among small scale tilapia farmers in Teso North Sub-County, Busia County, Kenya. This study thus sought to generate accurate information on water-quality parameters required for optimal production of Nile tilapia by small scale farmers in Teso North Sub-County, Busia County, Kenya.
Methods
This study was carried out in Teso North Sub-County (Fig. 1) which covers 236.8 Km2 in surface area with an estimated population of 117,947 (KNBS 2010). Teso North Sub-County has its main town located at Amagoro which lies at Latitude 0° 37′ 40.335′ N and Longitude 34° 19′ 57.2736 E at 1200 and 1500 m asl. The Sub-County is characterized by undulating terrain with highlands intersected by numerous valleys and two rivers namely: Malakisi and Malaba (Jaetzold et al., 2007). Most parts of the Sub-County receive mean annual precipitation of between 800 and 1700 mm (MoPND, 2008). Mean maximum temperatures range between 26 and 30 °C while the mean minimum temperature ranges between 14 and 22 °C. A total of 184 households were engaged in fish farming at the time of the study (RoK, 2010). About 95% of the farmers cultured tilapia in earthen fish ponds.
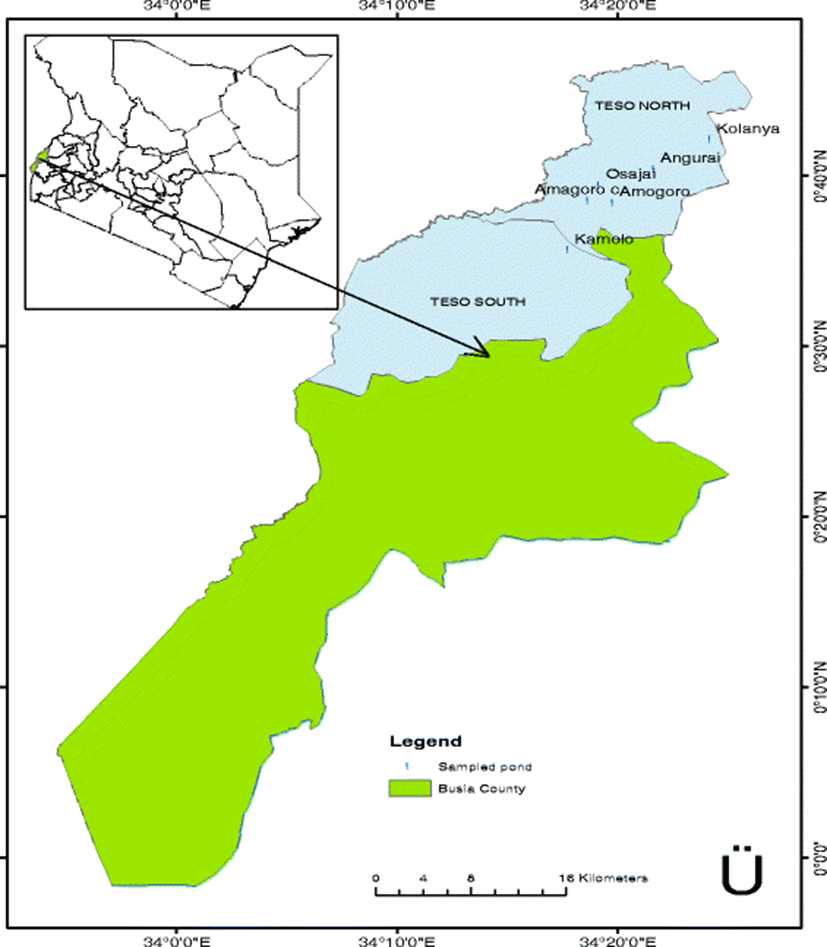
A longitudinal research design was adopted for this study in which measurements were done fortnightly for four months. A total of six earthen fish ponds were selected, five of them through systematic random sampling and one selected purposively to act as a control based on its high yields recorded during the previous harvesting season. The fish ponds were classified into two classes based on the sources of their water supplies, i.e., well-surface flow ponds which comprised of Kamolo, Amagoro, and Osajai and underground spring-fed ponds comprising of Kolanya and Angurai. Each pond had an area of 300 m2 and an average depth of 1 m.
Each of the six ponds was initially fertilized 7 days prior to stocking, using organic manures from farm animals at a rate of 5 kg/100 m2/week (Ngugi et al.,2007). Male Nile tilapia fingerlings each weighing about 5 g and measuring about 0.4 cm total length were stocked at a stocking density of three fish per m2 in the six earthen ponds. Each pond was stocked with a total of 900 fingerlings. The culture system was semi-intensive and expected production from each pond based on the preferred stocking density was 240 kg (Ngugi et al., 2007). The fish were fed twice a day (at 10:00 and 16:00) with the amount of feed being proportional to 10% body weight.
Six sampling sites (two sites near the inlet, two in the middle, and two near the outlet) were identified within each fish pond. Fish growth (mean length and width) was conducted fortnightly alongside measurement of physico-chemical parameters for a period of 4 months. Sixty fish were randomly sampled from each earthen pond using a seine net of 10 mm mesh size. The fish samples were anesthetized using AQUI-S (a sedative and/or anesthetic that provides control in animal husbandry, fish transportation and research operations) at a dose of 2.5 mL/100 L of water in a bucket prior to taking measurements to avoid stressing them. Their total lengths (TL) in centimeters and weights in grams were taken immediately using a fish measuring board and an electronic weighing scale, respectively. After the measurements, fish were transferred into a bucket containing clean water for stabilization before releasing them back to the pond. Specific Growth Rate (SGR) was calculated fortnightly for a period of 112 days. Specific growth rate refers to percentage increase in body dimensions per time and the results are given in percentage increase per day (Hopkins, 1992). The formula for calculating the SGR is as follows:
Where: wi is initial weight/length,
wt is final weight/length,
t is time in days.
A YSI multi-parameter probe (HI 9828 - YSI Incorporation, Yellow Spring, USA) was used to measure dissolved oxygen, temperature, pH and conductivity in situ. Total ammonia nitrogen (TAN) was also measured in situ using ammonia test kit (Model HI28049, Hach, USA). Each of the six ponds had recordings taken at the bottom, mid-water, and near the surface at 08:00, 10:00, 12:00, 14:00, 16:00 and 18:00 on different sampling days.
Descriptive statistics was used to outline the basic features of the data in the study by giving simple summaries like the mean and standard deviation of weight and length of fish and other physico-chemical parameters. Analysis of variance (ANOVA) was used to test the study hypotheses. The relationships between fish growth and physico-chemical parameters were determined using correlation and multiple regression analyses.
Results and discussions
Dissolved oxygen levels measured in the six earthen fish ponds showed the highest (10.6 ± 8.4 mg/L) levels to be in the control earthen pond and lowest (4.9 ± 2.8 mg/L) levels at Osajai earthen pond, though the difference was not statistically significant (F(5,53) = 1.72, p = 0.1483) (Table 1).
Means with different supercripts in the same column are significantly different at P<0.05 (Data analyzed by Duncan's Multiple Range Test)
The average dissolved oxygen (DO) levels in the six ponds ranged from 4.86 mg/L to 10.53 mg/L during the entire study period of 112 days with a mean of 7.066 mg/L (Table 2). According to Riche and Garling (2003), the preferred DO for optimum growth of tilapia is above 5 mg/L. Other researchers have however proved that tilapia can tolerate condition of high oxygen super saturation of up to 40 mg/L (Tsadik and Kutty, 1987). On the lower limit, Ross (2002) noted that DO concentration of 3 mg/L should be the minimum for optimum growth of tilapia. Generally, fish growth and yields are greater in ponds with higher DO concentration (Bartholomew, 2010). In the current study, all ponds recorded minimum DO levels of less than 3 mg/L at certain times during sampling save for Angurai pond where the minimum DO concentration was 6.04 mg/L. Dissolved oxygen levels were significantly different per growth period (days) (F = 2.02, p = 0.044), with highest (9.29 ± 4.22 mg/L) DO levels recorded on day 0 and lowest (5.33 ± 3.83 mg/L) on day 56. The reduction in DO on day 56 could have been as a result of increased uptake by microorganisms during breakdown of accumulated organic matter in the pond. As regards diurnal oxygen variations at different sampling times, the findings showed different trends in each pond in relation to time of sampling, though the lowest DO levels were recorded at dawn across all the ponds. Consistent with the current study findings, Boyd (2010) also noted that in pond aquaculture, the lowest level of DO concentration is likely to occur at night.
Means with different supercripts in the same column are significantly different at P<0.05 (Data analyzed by Duncan's Multiple Range Test)
Conductivity levels varied significantly between the six earthen ponds (F(5,53) = 6.31, p = 0.0001) with further analysis showing significantly lower conductivity levels at Amagoro compared to all the other ponds. The average conductivity in each of the six ponds ranged between 34.67 μS/cm and 86.67 μS/cm. Diurnal mean conductivity between 08.00 and 16.00 at different ponds varied ranging from 24.32 to 99.42 μS/cm (Table 1). Conductivity levels also varied significantly at different durations (days) during sampling (F(8,311), =9.92, p = 0.0001), with highest conductivity (83.81 μS/cm) recorded on day 70 and lowest (42.58 μS/cm) on day 112 (Table 2).
Given that conductivity in aquatic ecosystems is mostly driven by soil composition or the bedrock on which a river flows (Russell et al., 2011), the varying conductivity levels observed in the six ponds could be attributed to the bedrock material on which the ponds were sited but could also be a result of human activities. Crane (2006) noted that conductivity values greater than 100 μS/cm were indicative of human activity. According to Russell et al. (2011), water conductivity of between 150 and 500 μS/cm is ideal for fish culture (Russell et al., 2011). Stone et al. (2013), however, put the desirable range of conductivity for fish ponds at between 100 and 2000 μS/cm. It is therefore important to consider the rock type and soil composition of a site before construction of a fish pond.
pH levels showed a narrow range of variation between different fish ponds, with the highest (6.76 ± 0.31) mean pH recorded at Kamolo and the lowest (6.32 ± 0.15) at Amagoro. There were, however, no significant difference in pH between the six earthen ponds (p = 0.091) (Table 1). pH level differed significantly between sampling days (F(8311) = 4.86, p = 0.0001) with the lowest pH (6.35) recorded on day 42 and highest (6.87) on day 70 (Table 2), while the mean daily pH between 08.00 and 16.00 fluctuated between 6.07 and 6.94 with only three ponds (Kolanya, Angurai, and Kamolo) having their pH ranging between 6.5 and 9; which is the ideal range for tilapia culture as reported by Bolorunduro and Abba (1996). Boyd (1998) noted that the daily fluctuations in pH result from changes in the rate of photosynthesis in response to daily photoperiod. As carbon dioxide accumulates in the water during the night, the pH falls. The process could be responsible for the low pH levels recorded in some of the ponds in this study. BEAR (1992) reported a pH range of between 6.5 and 9.0 as optimum for growth of tilapia. Crane (2006) reported that highly acidic water with pH less than 5.5 limited fish growth and reproduction, noting that the ideal pH range for freshwater aquaculture should range between 6.5 and 7.0, though a pH range of 6.1 to 8.0 is also considered satisfactory for the survival and reproduction of fish. Bryan et al. (2011) concurs that most fish would do better in ponds with a pH near 7.0 and that ponds with a pH less than 6.0 may result in stunting or reduced fish production.
Temperature levels differed significantly across the six earthen ponds (F(5,53) = 3.31, p = 0.012), with further analysis (DMRT) indicating a significantly higher mean temperature (26.5 ± 2.4 °C) at the control pond than all the other earthen ponds, whose levels ranged between 23.5 and 24.5 °C (Table 1). There were significant differences in temperature in relation to duration of study (days) (F(8311) = 8.71, p = 0.0001) whereby highest temperature (25.67 ± 2.53 °C), was recorded on day 98, while the lowest (22.99 ± 1.63 °C) was recorded on day 42 (Table 2). Temperatures between 20 and 36 °C have been reported by various researchers as being suitable for tilapia culture. According to Kausar and Salim (2006), for instance, the preferred temperature range for optimum tilapia growth in ponds is between 25 and 27 °C. FAO (2011) reported the preferred temperature ranges of between 31 and 36 °C, while Ngugi et al. (2007) gave a range of between 20 and 35 °C as ideal for tilapia culture. These previous studies are consistent with the current study findings in which the highest SGR of 4.4%/day was recorded at a water temperature of 35 °C in the control pond.
The mean ammonia levels in the six ponds ranged from 0.01–0.4 mg/L though the differences were not statistically significant (p = 0.59) (Table 1). Ammonia levels were significantly different with respect to the period of study (days) (F(8311) = 18, p = 0.0001), with the lowest (0.008 mg/L) levels recorded on day 28 and highest (0.086 mg/L) on day 70 (Table 2). According to TNAU, (2008), the optimal range of un-ionized ammonia is 0.02–0.05 mg/L in fish ponds. Consistent with this study, BFAR (1992) also reported ammonia levels of between 0.02–0.05 mg/L as the optimum for tilapia growth. Emerson et al. (1975), however, noted that a concentration of 0.6 mg/L of un-ionized ammonia, is capable of killing fish even if exposed briefly while chronic exposure to levels as low as 0.06 mg/L can cause gill and kidney damage and reduction in growth.
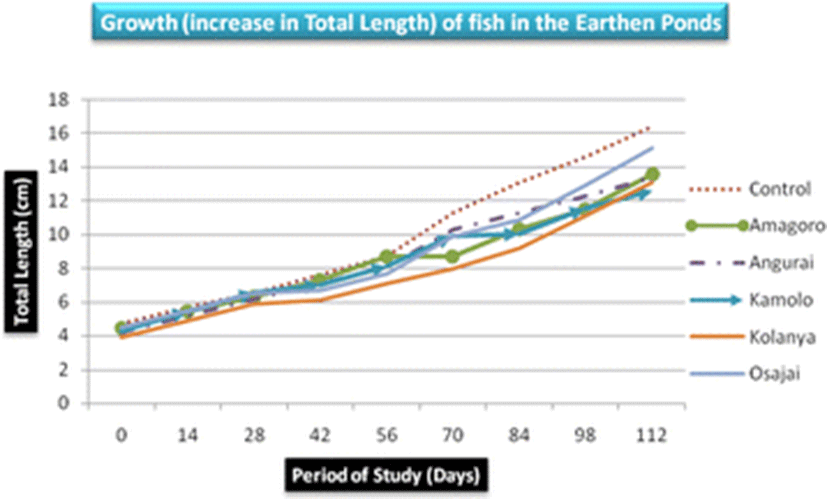
There was no significant difference in mean length and weight of fish obtained from the six earthen ponds (p = 0.858 and p = 0.42, respectively). Nevertheless, fish obtained from the control earthen pond registered the highest mean length (9.82 ± 4.24 cm) and weight (31.03 ± 28.5 g) while Kolanya fish pond recorded the lowest mean length (7.74 ± 2.9 cm) and Kamolo fish pond recorded the lowest mean weight (17.1 ± 11.95 g) (Table 3). The growth of fish in total length was almost uniform increasing steadily from below 5 cm to over 12 cm on day 112 (Fig. 2). However, the highest mean total length was recorded in the control earthen pond and the least in Kolanya earthen pond (Table 3).
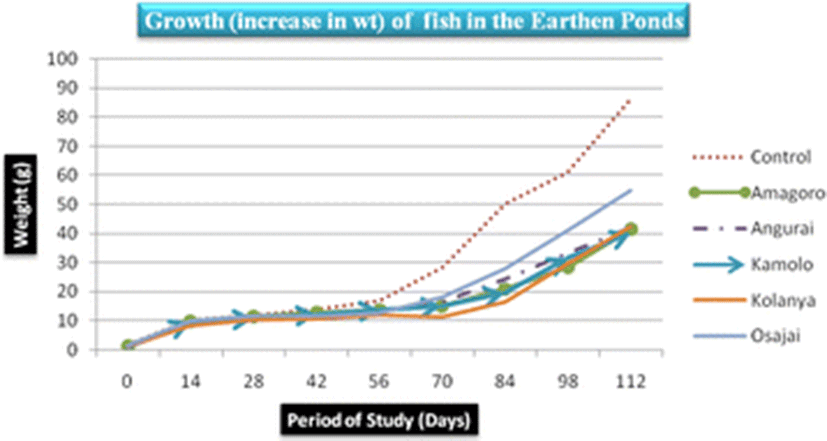
The control earthen fish pond recorded the highest mean fish weight (31.03 ± 28.5 g) while Kamolo earthen fish pond recorded the lowest mean fish weight (17.1 ± 11.95 g) (Table 3). The difference in weight gain betweeen the control pond and Kamolo fish pond could be attributed to ideal conditions in the control fish pond, quality of water in the pond, feed availability, and stocking density, all of which may have favored the development of tilapia in the control pond (Ngugi et al., 2007). Further analysis of weight data collected on the 28th and 42nd day in Kolanya pond indicated a constant specific growth rate of 2.3% over the 14 days period, implying stunted growth of fish in this particular pond (Fig. 3).
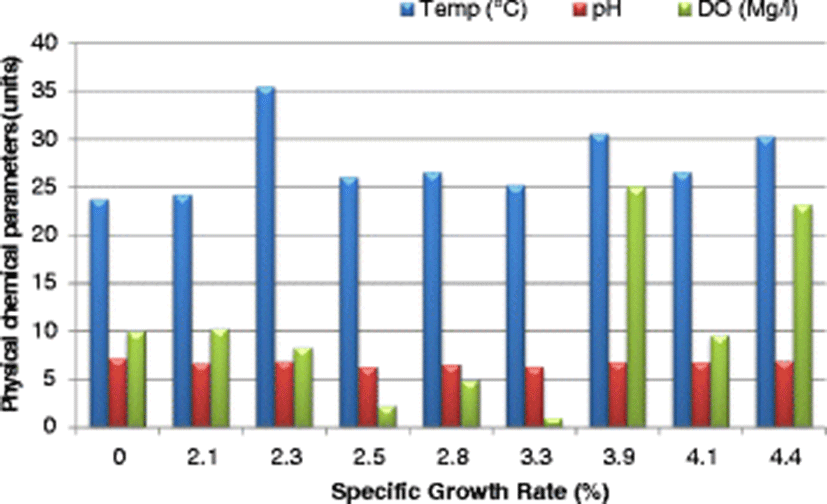
The SGR attained at the end of the study (after 112 days), ranged from 3.7–4.4%/day. The highest SGR of 4.4%/day was attained in the control pond under the following water quality parameters: DO was 23.2 mg/l, pH was 6.94, temperature was 30.25 °C, ammonia was 0.01 mg/l and conductivity was 23.5 μS/cm. Given that the SGR was highest in the control pond corresponding to a DO of 23.2 mg/l (Fig. 4), it is clear that high DO levels influenced the growth of fish positively. Osajai pond recorded 4.0%/day SGR, while the other four earthen ponds all recorded the same growth rate of 3.7%/day SGR (Table 4).
Dissolved oxygen affects the growth, survival, distribution, behavior, and physiology of fish and other aquatic organisms, and therefore oxygen depletion in water leads to poor feeding of fish, starvation, reduced growth, and more fish mortality, either directly or indirectly (Bhatnagar and Garg, 2000).
According to Bhatnagar and Singh (2010) and Bhatnagar et al. (2004) DO level > 5 ppm is essential to support good fish production. Bhatnagar et al. (2004) also suggests that DO levels of 1–3 ppm has sub lethal effect on growth and feed utilization, while DO levels of 0.3–0.8 ppm is lethal to fishes. Ekubo and Abowei (2011) also cautioned that fish are likely to die if exposed to less than 0.3 mg L-1 of DO for a long period of time. Avoiding excessive application of fertilizer or organic manure can help manage the levels of DO in fish ponds. Control of aquatic weeds and phytoplankton, as well as recycling of water and use of aerators can also be used by small-scale fish farmers to manage DO levels in earthen pond (Bhatnagar and Devi, 2013).
An increase in SGR was noted with a corresponding increase in temperature before falling sharply at a temperature of 35.53 °C. The highest SGR of 4.4%/day was recorded at a temperature of 30.25 °C (Fig. 4). In the current study, the highest SGR was also obtained at a pH of 6.94 (near neutral) (Fig. 4), conductivity of 77.0 μS/cm (Fig. 5), and ammonia of 0.01 mg/l in the control pond. Consistent with the current study findings, Santhosh and Singh (2007) reported the suitable pH range for fish culture ranges between 6.7 and 9.5. Fish have an average blood pH of 7.4, and therefore a little deviation from this value, generally between 7.0 to 8.5 is more optimum and conducive to fish life. However, fish can become stressed in water with a pH ranging from 4.0 to 6.5 and 9.0 to 11.0 and death is almost certain at a pH of less than 4.0 or greater than 11.0 (Ekubo and Abowei, 2011). High pH levels can be reduced by addition of gypsum or organic matter, while low pH levels can be rectified bu. application of quick lime (Bhatnagar and Devi, 2013).
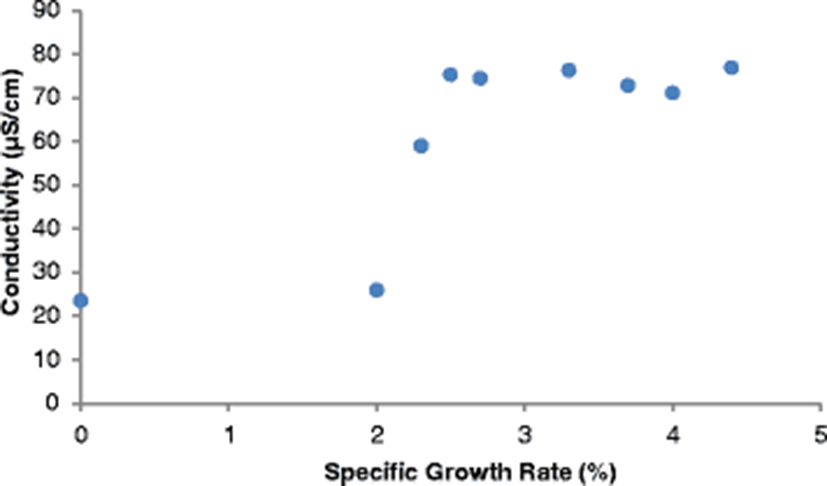
Optimum conductivity for high fish production differs from one species to another. Stone and Thomforde (2004) recommended the desirable range 100–2000 μS/cm and acceptable range 30–5000 μS/cm for pond fish culture. The conductivity level of 77.0 μS/cm recorded in the control pond in the current study and which corresponded to the highest SGR was however slightly lower than the desirable range described by Stone and Thomforde (2004). Studies indicate that ammonia is a by-product from the metabolism of proteins excreted by fish and bacterial decomposition of organic matter like wasted food, feces, dead plankton among others (Bhatnagar and Devi, 2013). It has been observed that ammonia in the range > 0.1 mg/L tends to cause gill damage in fish, destroy mucous producing membranes, and cause sub-lethal effects like reduced growth, poor feed conversion, and reduced disease resistance (Bhatnagar and Devi, 2013).
Maximum limit of ammonia concentration for aquatic organisms is 0.1 mg/L (Santhosh and Singh, 2007), while Bhatnagar and Singh (2010) recommended that ammonia levels of < 0.2 mg/l are suitable for pond fishery. Consistent with these scholars, it was noted in the current study that the highest SGR for the control pond was registered at an ammonia level of 0.01 mg/l, which was within the recommended < 0.2 mg/l ammonia for fish culture in ponds. Increasing pond aeration, regular water change, addition of quicklime are some of the ways that farmers can use in managing ammonia within their fish ponds (Bhatnagar and Devi, 2013). Given the specificity of certain parameters to the growth of fish, it is imperative to ensure that the various physico-chemical parameters are at their optimal levels at all levels during the entire process of fish culture in ponds.
A strong positive correlation was observed between mean fish weight and: mean length (r = 0.92949, p = 0.0001), temperature (r = 0.57488, p = 0.0001), and dissolved oxygen (r = 0.30620, p = 0.0243), while mean fish weight showed a negative correlation with conductivity (r = −0.37724, p = 0.0049) (Table 5).
A positive correlation was also observed between mean fish length and temperature (r = 0.54232, p = 0.0001) and a negative correlation between mean fish length and conductivity (r = −0.34323, p = 0.0111). A fish pond with good water quality is likely to produce more and larger fish than a pond with poor water quality (Boyd, 1998). For instance, analysis of weight data collected on the 28th and 42nd day in Kolanya pond indicated a constant specific growth rate of 2.3% over the 14 days period, which was an indication of stunting of fish over that duration probably due to the effect of poor water quality.
An analysis of physico-chemical parameters during that period revealed that the mean dissolved oxygen and temperature levels during the same period ranged from 3.11–3.88 mg/l and 20.77–20.94 °C, respectively. The levels of these two parameters could have been low for the optimal growth of tilapia in the Kolanyo earthen pond. In a different study, Abo-State et al. (2009), reported a SGR of between 3.308 and 3.513%/day in tilapia fish cultured within a 70 day period under the following average values of water quality parameters: DO was 7.5 mg/L, pH was 7.6, temperature was 27.5 °C, total ammonia nitrogen (TAN) was 0.040 mg/L (Abo-State et al.,2009). Mbugua (2008) reported that at stocking density of 2 fish/ m2, male tilapia can attain 200 g and above in 4 to 5 months. However in this study in which the stocking density was 3 fish/m2, the male tilapia in the six ponds attained mean weights ranging between 42.4 ± 0.9 g and 86.1 ± 1.3 g.
According to USDA (1996), water quality in ponds changes continuously and this often affects the optimal levels of physical and biological characteristics. As was the case in the current study, high dissolved oxygen levels and high temperatures tend to favor the growth of fish in earthen ponds. Studies concur that most biological and chemical processes within fish ponds are influenced by temperature, hence the need to ensure that the temperatures are maintained at optimal levels and that the same temperature favor the optimal growth if the fish species reared.
In the control pond, 99.9% of the variation in fish weight was explained by the five physico-chemical parameters, while that of the other five fish ponds ranged between 66.8 and 99.5%. The multiple regression analysis generated different R2 values for each of the six earthen ponds as indicated in Table 6.
aPredictors: (constant), ammonia, conductivity, pH, temperature, dissolved oxygen
Partial regression coefficient (B value) defines the direction and the magnitude of the slope of a regression line. In the current study, the B values associated with pH (−4.56) and conductivity (−0.154) bore negative signs, implying that for every increase in one unit of pH and conductivity, the regression equation predicted a decrease of 4.56 g and 0.154 g of fish weight (dependent variable), respectively. The B values associated with DO, temperature and ammonia bore positive signs, implying that for every increase of one unit of these parameters, there was a corresponding increase in fish weight by a certain unit. For instance, the regression equation predicted an increase of 2.409 g of fish weight with every increase of one unit of temperature.
Conclusions
In conclusion, dissolved oxygen, temperature and ammonia in the earthen ponds were within the optimum range for growth of tilapia, while conductivity and pH were not. The water used for culture of tilapia was slightly acidic. The control pond registered the highest growth of tilapia while the same differed in other fish ponds with stunted growth experienced in Kolanya fish pond between day 28 and 42. The stunting was attributed to unfavorable temperatures that did not support the optimal growth of fish. Based on the findings therefore, it can be concluded that the low yields from the ESP fish ponds in 2010, was directly attributed to poor water quality in the earthen ponds, either because of lack of the right information or ignorance among the fish farmers.
Any changes to their environment add stress to the fish, and the larger and faster the changes, the greater the stress. It is therefore recommended that water of good quality as well as maintenance of all the other factors is very essential for ensuring maximum yield in a fish pond. This can only be achieved through sensitization and educating the fish farmers on comprehensive management of aquaculture systems.
Good water quality refers to that with adequate oxygen, proper temperature, transparency, limited levels of metabolites, and optimum levels of other environmental factors affecting fish culture. This information would enable the farmers to take better care of their fish ponds by frequently monitoring the conditions of the ponds, fish behavior, and water color for any abnormal changes.