Introduction
Fishes are the most diverse of any vertebrate group and teleosts diversity in particular constitutes an assemblage that is larger than all other vertebrates put together. Fish, in a sense, do practically everything. They have experimented in an evolutionary sense with nearly every kind of adaptation that can be seen modified in more derived vertebrates (Kumar, 2013). These adaptations may be structural, physiological, as well as behavioral (Kumar, 2013; Morrow & Fischenich, 2000).
Maintaining the species diversity of fish that live in streams is one of the streams’ ecological goals. Identifying patterns of variation in stream-dwelling fish assemblages, as well as potential contributory reasons, is a major issue in stream ecology (Godinho et al., 2000; Koel & Peterka, 2003). The ability to properly estimate ensemble attributes (e.g., species richness, composition, relative abundance) has crucial consequences for the management, and conservation of ecological assemblages (Godinho et al., 2000).
Changes in species richness, relative abundance, and species composition in aquatic environments have been thought to imply a loss of biodiversity or biotic integrity (Cheng et al., 2012), and fish assemblages have been recognized as reliable indicators in reflecting aquatic ecosystem health (Ibarra et al., 2003; Rashleigh, 2004) or habitat quality such as flow regulation, habitat degradation (like physical habitat alteration and fragmentation), environmental contamination (e.g., eutrophication, acidification, and chemical pollution) (Vila-Gispert et al., 2002). In addition, in fisheries research, there is often a need to sample fish from natural environments. This may be for monitoring (e.g., traditional fisheries assessments including determining species abundance, diversity, and population structure) or to collect fish for research (e.g., for implantation of telemetry tags, collection of fish for lab studies). As a result, fishes have received considerable attention in biomonitoring, characteristics of their environment, and other forms of aquatic life (Vila-Gispert et al., 2002).
In addition, the characterization of fish community composition is an important aspect of conservation plans and water quality assessments in flowing waters. Fish community composition and abundance are sensitive to a variety of environmental perturbations. Efforts to quantify these parameters involve the creation of appropriate sampling procedures or standards which themselves are often heavily influenced by considerations of manpower and budget (Kimmel & Argent, 2006).
It is a common view that freshwater fish live not in random groupings but in structured communities held together by favorable abiotic and biotic mechanisms. In some cases, a small number of local environmental variables such as temperature, dissolved oxygen, pH, electrical conductivity, etc., seem to exercise a strong influence on community structure, while in others it is related to a wider range of factors such as geographical factors like altitude, surface area, etc. (Edds, 1993). The structure of fish assemblages may also be a result of stochastic factors such as disturbance or deterministic interactions like competition and predation (Grossman & Freeman, 1987).
Knowledge of the diversity, distribution, and relative abundance of fish in the streams is of vital importance to ensure better water quality management and conservation activities. The Ethiopian highland streams and rivers seem to be a center for fish diversity on the African continent (Stiassny & Getahun, 2007). Few taxonomic studies in these water systems showed that Garra was the dominant genera (Stiassny & Getahun, 2007). Moreover, artificial micro dams constructed in Tigray were also inhabited mainly by Garra species (Asmelash et al., 2007; Dejenie et al., 2008; Teferi et al., 2013, 2014). As to our current knowledge, there is no study on the diversity, distribution, and abundance of fish communities on the highland streams or rivers of Tigray. Therefore, the present study is an attempt: (1) To document the freshwater fish species abundance and relative abundance in the study streams, (2) To compare the freshwater fish species richness and diversity in the study streams, (3) To compare the fish abundance, richness, and diversity of Elala and Gereb Tsedo (GTS) streams with their confluence sites.
Materials and Methods
The current study was conducted in two streams Elala and GTS that pass through Mekelle city (Fig. 1). The Tigray National Regional State, located in northern Ethiopia, has Mekelle as its capital. The city’s North Western and South Western sections are traversed by the sporadic streams GTS and Elala, respectively. People use these stream waters for washing clothes and for livestock drinking. Moreover, these streams provide several services to the community such as household use, irrigation, production of building materials (bricks), and carwash activities along their gradients from the headwater as they pass down through the city. These two streams join together and make Mariam Dahan stream. This common stream further continues down to make Romanat stream (Fig. 1).
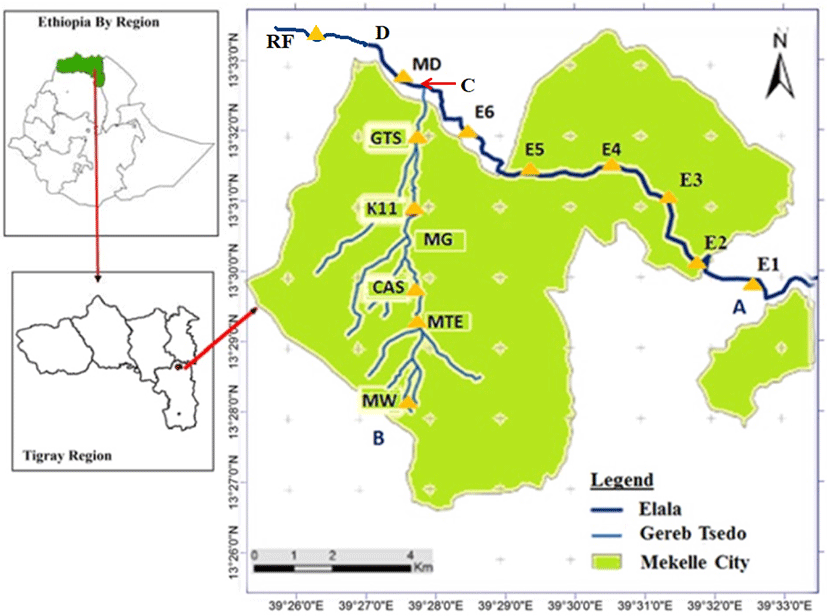
Elala’s headwaters are located in Aragure, about 16 kilometers from Quiha (Fig. 1). The second stream (GTS) is known by several names as it flows through the city. The initial source and headwater of this stream rises from the compounds of May Weini complete primary school (Fig. 1) and progresses to Catholic and Adventist schools, where it is known as May Tsaeda Egam. After that it continues to run downhill on the west side of Abraha Castle (CAS site) and named May Gifaf before it reaches Kebele 11. Then further continues downward and is named GTS. It continues its way with some small tributaries joining it with wastewater discharged from the town and finally joins Elala stream at Mariam Dahan (Fig. 1).
Fish specimens were collected using standardized backpack electrofishing: depletion sampling techniques as described in Zippin (1958) and (“Zippin” method) (SFCC, 2007; Zippin, 1958). Electrofishing from the two study streams and Mariam Dahan, where the two streams meet, was carried out during the third week of August, December 2013, and March 2014. Before their confluence, each stream had six sampling locations, and once they united, they each had two common sites. Using global positioning system (GPS) data, sites were identified and situated at an average distance of 0.65 km between two successive sampling locations, taking into account the streams’ wadeability and accessibility. The stretch of each sampling site (having 3 habitats) was approximately 50 to 100 meters. The time for each run was 5 minutes, and the time gap between the runs was 20 minutes. A consistent sampling design for each site in each sampling period was applied to avoid biased results (Jha et al., 2005). Samples were collected in a particular stream at the scheduled time for all study periods along the same reach, which included all major microhabitats of the stream: pools, runs, and riffles (Jayaratne & Surasinghe, 2010; Jones et al., 2003). Pools are deep with slow water. Runs are deep with fast water and little or no turbulence. Riffles are shallow with fast, turbulent water flowing over rocks (Cushing & David Allan, 2001). Each of the two study streams had six sites with three habitats (pools, runs, and riffles) and two sample runs (Jayaratne & Surasinghe, 2010; Jones et al., 2003). In addition, two sites were visited downstream of the confluence, each containing three habitats and two streams. The total number of sampling sites upstream and downstream of the confluence of both streams was 14 (6 upstream of the confluence and two downstream).
Fish specimens were collected and identified using keys and descriptions of Stiassny & Getahun (2007). Specimens of every species were tallied. Five to ten specimens of unknown species were sent to the lab for species validation and confirmation after being stored in 10% buffered formalin.
Fish species richness and the total number of species per stream and per microhabitat were calculated for each stream (Magurran, 1988). Species diversity for each site was calculated using the Shannon index of diversity using the standard formulae: (Kwak & Peterson, 2007; Shannon & Weaver, 1949). H’ = –Σpi ln(pi), where pi = ni/N; ni is the number of individuals of ‘i’th species and N = Σni. Then these biodiversity indices were used to compare the pattern of fish composition among the study sites and between microhabitats within the stream.
At each sampling site, the following physicochemical parameters such parameters measured: water flow (velocity, m/s), water depth (cm), water temperature (°C), pH, conductivity (µS/cm), and dissolved oxygen (mg/L). Stream velocity was measured using the floatation method of Gordon et al. (1992). Conductivity, pH, oxygen concentration, and water temperatures were measured in-situ using a conductivity meter (SX713, SANXINS, Shenyang, China), pH meter (pH-013, HINOTEK, Ningbo, China), and oxygen meter (HQ40d multimeter, Hach, Loveland, CO, USA), respectively. Besides, other parameters like water transparency are measured using Snell’s tube (diameter 6 cm) (Sovell et al., 2000; Tesfay et al., 2019; Van de Meutter, 2005; Van de Meutter et al. ,2007). Turbidity and chlorophyll-a concentrations (as a proxy of phytoplankton biomass) were measured using a fluorometer (AquaFluor 8000-001, Turner Designs, San Jose, CA, USA) in the field. In addition, macrophyte cover (%) and shading by riparian (%) were estimated following the protocol of van de Meutter (2005).
Diversity data among habitats and streams were compared using one-way analysis of variance (ANOVA) and Tukey post hoc comparisons, using the statistical software package STATISTICA 11 (Statsoft, Tulsa, OK, USA). The normality and homogeneity were tested using the Sharpiro-Wilk and Levene’s tests, respectively. In addition, parametric t-tests were used to compare variables like species diversity, richness, evenness, total fish abundance, and fish species abundance within the stream and between the streams.
Composition of the fish community based on catch per unit of effort, that is to say, individuals/run (King, 1995) of each species of overall streams as well as from each separate stream was analyzed using species abundance and total fish abundance data. Two-way ANOVA was used to test the effect of season, habitat, and their interactions on fish abundance in the streams for temporal (season) and habitat differences.
Results
The physicochemical factors of the three streams tested (Table 1) show that dissolved oxygen concentration, pH, Chlorophyll a, and macrophyte coverage (%) were relatively high in Elala compared to the other two streams. Furthermore, in December, Elala stream site E2 had a maximum dissolved oxygen concentration of 14.6 mg/L and GTS stream site had a minimum dissolved oxygen concentration of 1.7 mg/L. During the study periods, the pH concentration fluctuated from 6.3 to 8.13. A minimum of 6.3 was reported at GTS stream site GTS-Rn (GTS run), and a maximum of 8.13 was observed at Elala (E2). In addition, the surface water temperature varied from 12.4°C to 26.8°C in Elala, 17°C to 25.1°C in GTS, and 19.3°C to 26.7°C during the study period.
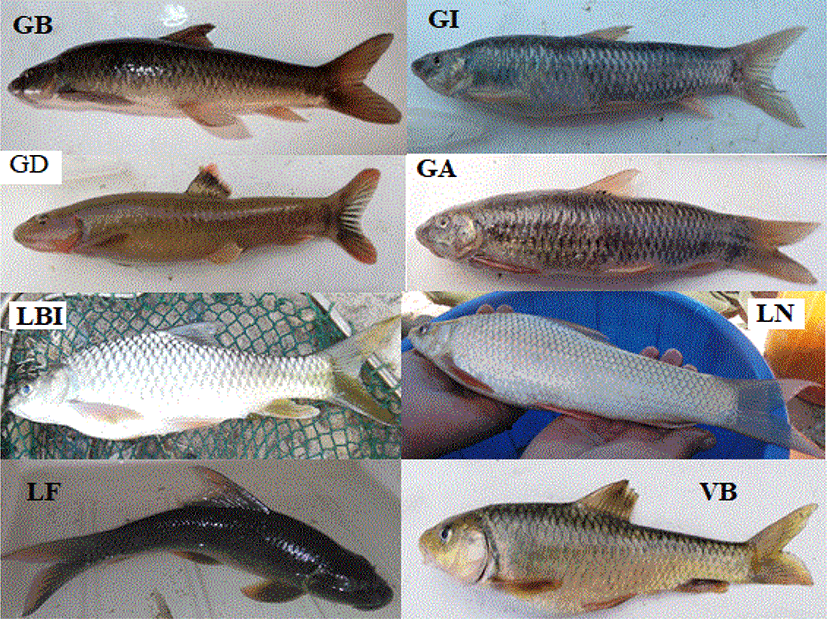
We collected a total of 8,410 individuals that belong to eight different fish species of the family Cyprinidae: Garra aethiopica, Garra blanfordii, Garra dembecha, Garra ignestii, Varicorhinus beso, Labeobarbus intermedius, Labeo niloticus, and Labeo forskalii (Table 3; Fig. 2). Among these, the first four Garra species, except G. aethiopica were recorded from the two study streams. However, G. aethiopica was detected only in GTS. Both streams account for about 6,554 (77.9%) of the total fish population or individuals collected during the study periods.
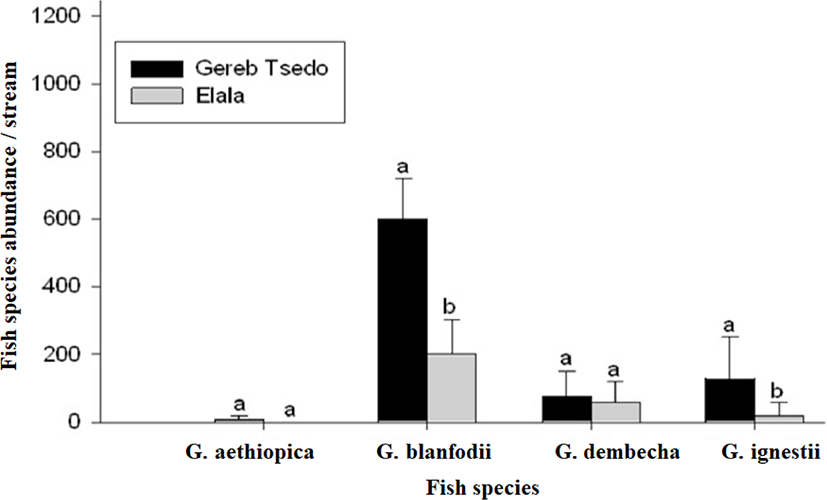
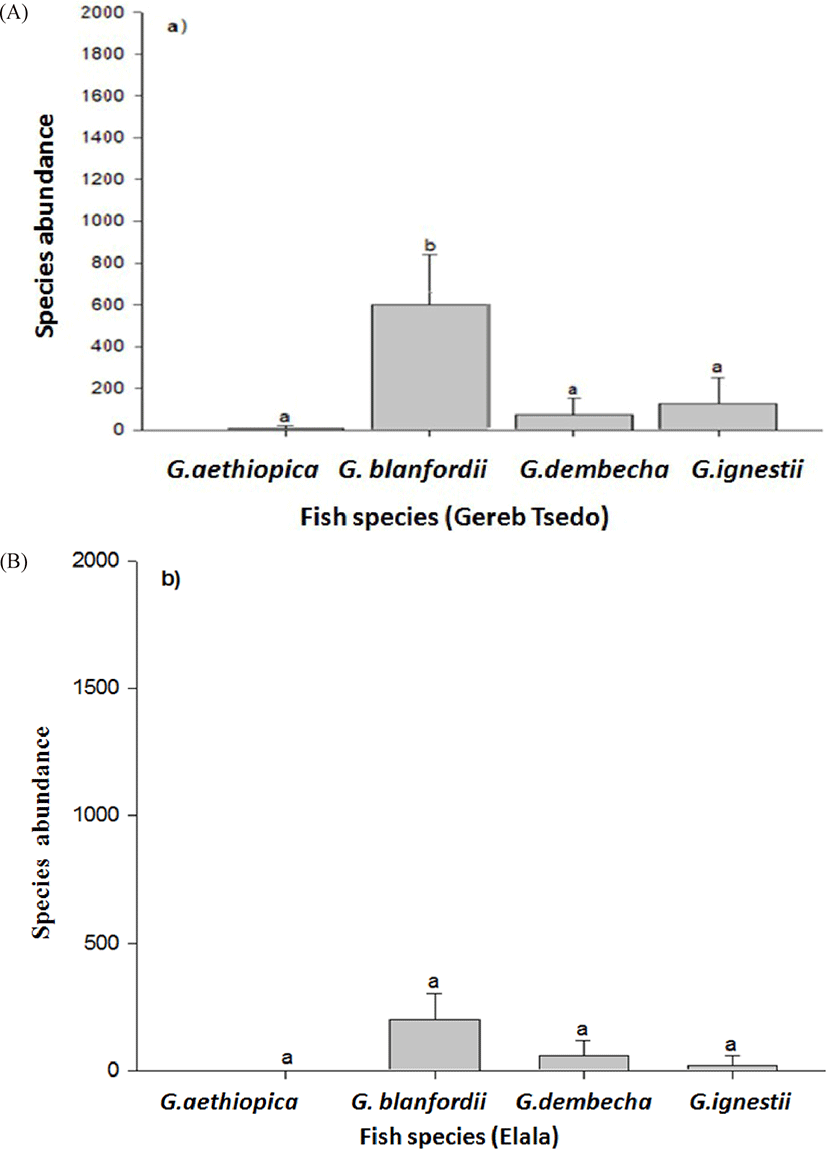
In GTS the total fish abundance (4,870; 74.3%) was significantly higher than Elala stream (1,684; 25.7%) (t-test, t = 1.444, df = 3, p < 0.05; Table 2). The total catch of G. blanfordii and G. ignestii in GTS were also significantly higher than that of Elala (Fig. 3; Table 3). There were no significant differences in the abundances of each of the other two species (G. aethiopica and G. dembecha) between the two streams (Fig. 3; Table 3). Comparison of fish species abundance within stream showed that G. blanfordii are dominant in GTS stream (Fig. 4A), while there were no significant differences among the species of Elala stream (Fig. 4B). There were no catch of G. aethiopica in Elala and lower catch in only two sites of GTS stream (Figs. 3 and 4; Table 2). Moreover, this species was not recorded from their confluence point (first site of Mariam Dahan stream) at Mariam Dahan church (Table 4). However, G. aethiopica was also recorded from the second site of Mariam Dahan which is from Romant stream (particularly below Romant Fall).
GA, Garra aethiopica; GB, Garra blanfordii; GD, Garra dembecha; GI, Garra ignestii; VB, Varicorhinus beso; LBI, Labeobarbus intermedius; LN, Labeo niloticus; LF, Labeo forskalii; GTS, Gereb Tsedo; ELA, Elala; MD, Mariam Dahan; MW, May Weini; MTE, May Tsaeda Egam; CAS, Castle; MG, May Gifaf; K11, Kebele 11; GTS, Gereb Tsedo; E1, Feleg Daero; E2, Elala2; E3, Elala3; E4, Elala4; E5, Elala5; E6, Elala6; RF, Romanat Fall.
In the two streams, the highest total relative fish abundance was recorded in pools followed by runs and riffles (Table 4). Species-wise, G. blanfordii was dominant which account for about 71% of the pool fish community recorded in the two streams followed by G. ignestii and G. dembecha with 15% and 13% of the pool fish community, respectively. Where the least abundant in pool was G. aethiopica only accounted for 1% of the pool fish community (Table 5). Overall, G. blanfordii showed significantly higher numerical abundance and dominated the fish community in pools (Table 5).
There was no significant seasonal difference in fish abundance but a pattern of increase in total relative fish abundance was observed between sampling periods (Two-way ANOVA).
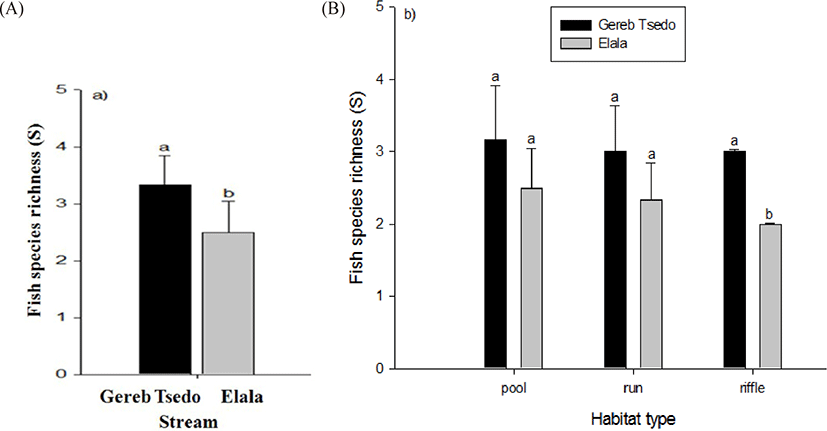
Fish species richness varied from 3–4 in the streams with the highest being in GTS stream (Tables 2 and 3; Fig. 5A and 5B) where the number of sample sites was the same in both streams. Species richness streams’ habitat ranges from 2–4. The highest fish species richness was recorded in pools. We have observed a significant difference in fish species richness between riffles of the two streams (t-test, t = 7, df = 5, p < 0.001, Fig. 5B).
The relative occurrence of the fish varies between sampling sites and among streams. For example, G. aethiopica, was found in two sites, while G. dembecha, G. blanfordii and G. ignestii are very widespread in GTS. Although widespread, G. dembecha and G. ignestii were more frequently found at relatively low abundances (Table 3; Fig. 2). Meanwhile G. blanfordii and G. dembecha were observed in all the study sites of Elala but G. ignestii occurred in 50% of the sampling sites of Elala stream (Table 3; Fig. 2).
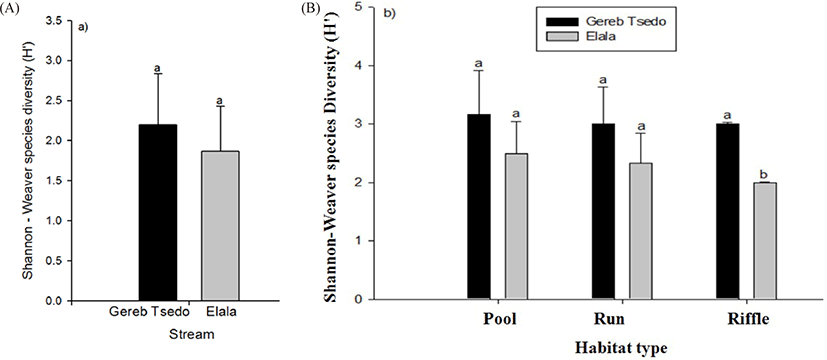
There were no statistically significant differences in species diversity (Shannon-Weaver Diversity, H’) between streams as well as between habitat types (t-test, t = 1.095, df = 5, p < 0.323; Fig. 6A, Table 5 and between habitats types; pools t = 1.475, df = 5, p < 0.200, runs t = 0.403, df = 5, p < 0.704, riffles t = 0.964, df = 5, p < 0.379, Fig. 6B, Table 5).
Mariam Dahan stream is the confluence of Elala and GTS streams. This site has two sampling sites Mariam Dahan and Romant. The fish species in the first site (Mariam Dahan) were similar to the two streams. The cyprinids of the genus Garra namely; G. blanfordii, G. dembecha and G. ignestii (Fig. 2) were recorded from this site. The total fish abundance of the three fish species was 566,145, and 122, respectively. Similar to most sites of the two streams the pools of this site retain the highest total fish abundances and riffles were the lowest. The fish species richness of the three microhabitats was equal; three species each (Table 5). Whereas the second site (Romant stream) retains a maximum of eight species where four of the fish species were not recorded from the 13 upper sites (headwater streams). These fish species were all cyprinids namely, V. beso, L. intermedius, L. niloticus, and L. forskalii (Table 3; Fig. 2).
Discussion
From the above observations, it is obvious that all the physicochemical parameters and habitat characteristics like water depth, velocity, and river bed width are some of the major factors for the distribution, abundance, and richness of species in different habitats. Habitat wise and/or between streams parametric t-test and other statistical comparisons showed the variability of the above metrics. Gorman & Karr (1978), Arunachalam (2000), Johal et al. (2002) and Negi et al. (2007) made similar observations.
To the best of our knowledge, this study represents the first study of riverine fish diversity, richness, and abundance in the streams: GTS and Elala. We investigate the patterns of fish population composition along longitudinal (habitat) gradients. We showed that the two streams and their confluence point (Mariam Dahan) are inhabited generally by small-sized noncommercial fish Garra species and there was no longitudinal variation in species composition. However, at the second site of Mariam Dahan in Romanat particularly below the long waterfall (Romanat Fall) the species richness doubled. Among these species, three of them were commercially important.
Understanding the diversity, richness, and abundance of fish in stream and river ecosystems is among the central goals of tropical ecological research (Herder & Freyhof, 2006). Dominance by the ecologically diverse Cyprinid family is common in East African and Southwest Asian freshwater systems (Beamish et al., 2006; Stiassny & Getahun, 2007) which are also evidenced in the results of the current study. This is because cyprinids have evolved partially through highly adapted body forms and mouth structures to occupy all habitats (particularly lakes) throughout their distributions (Ward-Campbell et al., 2005).
Differences in stream types and habitat types each explained a significant proportion of the variation in the numerical abundance of fishes. Fish abundance strongly differed between streams and among habitat types. GTS harbors the highest fish abundance which might be due to higher food availability from organic matter and waste material inputs from the town. Yet, large debris of riparian vegetation and waste disposal from the town was observed at various points via the river course of GTS. Similar studies elsewhere showed a positive effect of the input of plant debris into streams on fish abundance (Wright & Flecker, 2004).
Our findings also showed that, among the habitats, the pool has the largest fish abundance, which is consistent with previous research (Freeman & Marcinek, 2006). The large and significant amount of variation explained by habitat type may indicate that habitat use is indeed potentially an important factor in determining total fish abundance (Tesfay et al., 2019).
The current study’s environmental variables (such as temperature, pH, and dissolved oxygen) had rather modest or weak associations with fish abundance. For the prediction of fish diversity and abundance, it was found that stream type and habitat type were the best predictors for fish abundance and species richness, compared to physicochemical variables (Tesfay et al., 2019).
Moreover, the two studied streams GTS and Elala including their junction area Mariam Dahan are generally intermittent and very shallow streams. But at some intervals they consist of some deep pools, important habitats for the Garra fish serving as a refuge and feeding habitat during the severe dry season due to the formation of patches. This mainly happened as result of pumping of the stream water for irrigation and construction issues such as bricks production.
Physical habitat structure is widely recognized as a major determinant of the distribution, abundance, and diversity of stream fishes (Pusey et al., 1993; Rice, 2005). The study streams are quite small and sporadic, with relatively shallow runs and riffles that are vulnerable to assaults from predators. Because of this, the research streams and pools had greater species diversity, abundance, and richness. Additionally, among the habitat types it was demonstrated that the pools are the lotic habitats which also support the highest mean species richness followed by runs and riffles.
Pool and run habitats were architecturally more complex and always deeper than riffles, as shown from the research streams. As a result, they offer fish a better habitat than riffles. Riffles often had a simple structural design, were shallow, and had little fish diversity or richness. Thompson & Larsen (2004) made a comparable observation and evaluation. Additionally, pools sustain the greatest diversity of fish because they have higher depths and slower currents than riffles and runs, as noted by Negi & Negi (2010) in their explanation of the Shannon-Weaver diversity index.
In this study, among the Garra fishes G. blanfordii dominates the abundance data, as they occupy all possible habitats. This might be due to their high adaptive variability, similar results were revealed by Johnson & Arunachalam (2009) in the study of cyprinids. Jayaram (1999) and others have also reported similar results on the cyprinids like Garra mullya. The wide distribution and large number of these species suggest that they can tolerate a wide range of environmental conditions (Pusey et al., 1993).
After the confluence point particularly in the second site of Mariam Dahan below the Romanat Fall, the fish species richness increased. The Garra species recorded in GTS and Elala streams were also found in Romant stream including G. aethiopica which was limited to GTS stream. Similar to GTS stream it was found in the microhabitats such as pools and runs. Although fish assemblage structure is usually higher in lower regions (lower altitudes) of streams and rivers in general as reported by different authors (e.g., Habteselassie, 2012; Paller, 1994; Rahel & Hubert, 1991), the barriers created by the natural waterfall might also affect the variability in fish species assemblage, distribution, and richness between the up and down steam of the waterfall (Liu et al., 2021). Literatures indicate that waterfalls are an important feature of freshwater ecosystems, affecting not only the physical environment but also the biological communities inhabiting them (Evelyn Hutchinson, 1957; Torrente-Vilara et al., 2011). Studies have shown that waterfalls can significantly impact the fish assemblage structure of rivers and streams, with different species adapting to the varying conditions created by waterfalls (Barbosa et al., 2015; Kano et al., 2012; Liu et al., 2021; Torrente‐Vilara et al., 2011). The effects of waterway barriers such as natural waterfalls on fish movements are expected to produce differing assemblage structures in riverine ecosystems (Rahel, 2007). In addition, such natural barriers may cause faunal discontinuities and increase dissimilarities in the ichthyofauna, as changes in landscape characteristics cause habitat alterations and increase species turnover along the longitudinal gradient (Rahel & Hubert, 1991).
Conclusion
In this study, eight fish species of family Cyprinidae representing four genera were identified. We observed that the fish abundance differed between streams and among habitat types. GTS harbors the highest fish abundance and among the habitats, the pool has the largest fish abundance. In general, the fish abundance in the study streams of GTS and Elala exhibited clear patterns among the gradients in stream type and habitat type. Most likely, habitat type and food resource differences between the streams, possibly combined with other unmeasured environmental gradients, were the most important driving factors behind variation among fish abundances. We do not interpret the observed patterns as signatures of dispersal limitation given that almost all species were widely distributed across the study area, and because habitat and stream type were found to be strongly collinear with each other. The wide spread of fish species in most of the study sites indicates a relatively high degree of mobility of species across the stream courses via the network of stream connections. Hence the effect of dispersal limitation may not be the case except for the large and commercially important fish’s limited upward dispersal by the waterfall.


