Introduction
Xenobiotic substances, such as medicines, plastics, detergents, and various other products, are beneficial to human life, but they can cause adverse effects after reaching toxic concentrations (Tijani et al., 2016). Once absorbed into the body, xenobiotics can undergo one or more of the following four distinct processes: elimination unchanged, retention unchanged, spontaneous chemical transformation, and enzymatic metabolism (Datta et al., 2022). Among these, enzymatic metabolism is the predominant mechanism for the elimination of most xenobiotics and is generally separated into three major reaction phases. Phase I reactions convert compounds to more hydrophilic compounds, providing a site-to-phase II conjugation. Phase II reactions increase the polarity of xenobiotics, and phase III reactions finally eliminate xenobiotics through urine, bile, and feces (Croom, 2012).
Glutathione S-transferases (GSTs) are phase II detoxification enzymes that metabolize the electrophilic substrate by conjugation with glutathione (GSH; γ-glutamyl-cysteinyl-glycine) (Gunderson et al., 2018). These enzymes play multifunctional roles in detoxification, hormone biosynthesis, drug resistance, maintaining the balance of reactive oxygen species (ROS), and other crucial biological processes (Hayes et al., 2005). GSTs are among the most versatile enzymes and are widely distributed in nature. They can be categorized into three major groups: cytosolic GSTs (alpha, beta, delta, epsilon, zeta, theta, mu, nu, pi, sigma, tau, phi, and omega), mitochondrial GSTs (kappa), and microsomal GSTs (Arockiaraj et al., 2014; Oakley, 2011).
Fish production plays a crucial role in addressing global food security and malnutrition issues. However, harsh environments, including intensive aquaculture systems and water pollution, can lead to disease and mortality in farmed fish (Zeitoun & Mehana, 2014). In particular, heavy metals can cause abnormal external movements, such as loss of equilibrium and irregular vertical movement, as well as severe internal damage to the gills and the renal and nervous systems of fish (Zeitoun & Mehana, 2014). Studies on fish GSTs have demonstrated that they are important enzymes involved in detoxifying various toxins. For example, in rainbow trout (Oncorhynchus mykiss), GST mRNA is upregulated in the gills following Zn exposure (Hogstrand et al., 2002). Similarly, the induction of GST in Nile tilapia (Oreochromis niloticus) and red-belly tilapia (Tilapia zillii) was observed after treatment with Zn nanoparticles (Saddick et al., 2017). Under Cd exposure, GST activity in marine catfish (Arius arius) is rapidly stimulated in a dose-dependent manner in the liver and kidneys (Mani et al., 2014). Moreover, increased GST activity has been observed in zebrafish (Danio rerio) following atrazine exposure (Zhu et al., 2011). These findings highlight the significance of fish GSTs as biomarkers of environmental contamination, as evidenced by their inducible nature in response to various toxicants in diverse fish species.
The redlip mullet (Liza haematocheila) is a widely distributed species in the North-Western Pacific Ocean. In general, redlip mullet are known to live in estuaries, exhibiting euryhaline behavior and migrating between brackish water and freshwater, while tolerating extreme temperatures. Owing to its rapid growth and high economic value, redlip mullet is the dominant mariculture species in China and Korea. However, high mortality from diseases caused by Lactococcus garvieae leads to substantial economic losses on mullet farms (Han et al., 2015). To date, several studies have been carried out on redlip mullet to understand the impact of L. garvieae on pathology and immune defense mechanisms (Harasgama et al., 2022). However, research on GSTs related with immune response in mullet has not yet been conducted. Therefore, the present study aimed to assess the redox reactions and immune responses of the omega and kappa classes of GST from redlip mullet.
Materials and Methods
This study was approved by the Institutional Animal Care and Use Committee of Jeju National University (Approval no. 2018-003). Healthy redlip mullets, weighing approximately 100 g, were obtained from a commercial fishery in Hadong, Republic of Korea. Before commencing the experiment, the mullets were kept in 400 L aquarium tanks at 20°C for acclimation to laboratory conditions. After one week, five healthy fish were anesthetized with tricaine mesylate (40 mg/L). Whole blood was collected using sterile syringes coated with heparin sodium salt (Affymetrix USB, Santa Clara, CA, USA) and centrifuged immediately at 3,000×g for 10 min at 4°C. Other tissues, including the skin, muscle, gills, head kidney, kidney, liver, spleen, stomach, intestine, brain, and heart, were also isolated for RNA extraction. All collected samples were snap-frozen in liquid nitrogen and stored at –80°C until further analysis. These RNA samples were used to construct a cDNA database and analyze the tissue distribution of LhGSTO1 and LhGSTK1 mRNA in different tissues.
To analyze the temporal expression of LhGSTO1 and LhGSTK1 upon immune stimulation, the fish were grouped and intraperitoneally injected with lipopolysaccharide (LPS; Sigma-Aldrich, St. Louis, MO, USA) at a dosage of 1.25 μg/g of fish body weight, polyinosinic:polycytidylic acid (poly I:C; Sigma-Aldrich) at dosage of 1.5 μg/g of fish body weight, and L. garvieae at a dosage of 5 × 10² colony-forming unit (CFU) / fish, respectively. The immune stimulants were diluted in 100 μL of phosphate-buffered saline (PBS). Additionally, 100 μL of 1 × PBS was injected into the control group using sterilized syringes. The dosages of the three stimulants were determined to be sub-lethal based on a preliminary experiment (data not shown), and no mortality was recorded during the whole experimental period. Blood tissues were excised from five fish in each group at 0, 6, 24, 48, and 72 h post-injection, followed by the same tissue sampling procedure in the section above.
Total RNA was isolated from a pool of excised tissues from five individual fish using RNAiso Plus reagent (TaKaRa, Shiga, Japan), according to the manufacturer’s protocol. The extracted RNA samples were purified using a RNeasy Spin Column (Qiagen, Hilden, Germany). The quality and quantity of RNA were assessed by visualization on 1.5% agarose gel and measuring the absorbance at 260 nm using a microplate spectrophotometer (Thermo Fisher Scientific, Waltham, MA, USA). Then, the cDNA for tissue-specific distribution and the temporal expression analysis was synthesized with a PrimeScript™ II 1st strand cDNA synthesis kit (TaKaRa) using 2.5 μg of total RNA. Finally, contracted cDNA was diluted (40-fold) in nuclease-free water and stored at –80°C.
Mullet cDNA was sequenced using the PacBio platform (Insilicogen, Yongin, Korea) and constructed by de novo assembly. The full-length cDNA sequence showing the highest homology between LhGSTO1 and LhGSTK1 was identified in the mullet transcriptome database. The open reading frames (ORFs) and amino acid sequences of deduced LhGSTO1 and LhGSTK1 were identified using the National Center for Biotechnology Information (NCBI) ORF finder (https://www.ncbi.nlm.nih.gov/orffinder/). The domain architecture of LhGSTO1 and LhGSTK1 was predicted by NCBI conserved domain analysis, ExPASy Protparam, NetNGlyc 1.0 server, and the SignalP 5.0 online tool. LhGSTO1 and LhGSTK1 amino acid sequences were compared to their different homologs using pairwise sequence alignment (PSA) and multiple sequence alignment (MSA) with EMBOSS needle software and the Clustal omega tool, respectively. Molecular Evolutionary Genetics Analysis (version 10.0) software (MEGA X) was used to analyze the evolutionary relationships and reconstruct a phylogenetic tree of LhGSTO1 and LhGSTK1 using the neighbor-joining method with 5,000 bootstraps.
The relative mRNA expression levels of LhGSTO1 and LhGSTK1 were measured in immune-unactivated and -activated tissues using a Thermal Cycler Dice™ TP950 Real-Time System (TaKaRa), as described in a previous study (Kim et al., 2019). The reaction of qRT-PCR was performed in 10 μL of reaction mixture containing 3 μL template cDNA, 1 μL nuclease-free water, 0.4 μL of each qRT-PCR primer (Table 1) designed with the Primer Quest tool of IDT (IDT, Coralville, IA, USA), and 5 μL of 2 × TB Green® Premix Ex Taq™ (Takara) under the following thermal cycling conditions: 95°C for 30 s; 45 cycles of 95°C for 5 s, 58°C for 10 s, 72°C for 20 s, and 95°C for 15 s; 60°C for 30 s; and 95°C for 15 s. All experiments were performed in triplicate. Redlip mullet elongation factor 1α (LhEF1α, accession no. MH017208) was selected as the internal reference gene to normalize the expression levels of LhGSTO1 and LhGSTK1. The Livak (2-ΔΔCT) method was used to calculate relative expression.
The ORFs of LhGSTO1 and LhGSTK1 were cloned into pMAL-c5X and pcDNA 3.1(+) cloning vectors for functional analysis. The LhGSTO1 and LhGSTK1 coding sequences were amplified using a TaKaRa PCR Thermal Cycler Dice TP600 (TaKaRa) with specific cloning primers (Table 1). The PCR conditions were as follows: 94°C for 5 min; 30 cycles of 94°C for 30 s, 58°C for 30 s, and 72°C for 60 s; and 72°C for 7 min. Subsequently, the PCR products and vectors were digested using the corresponding restriction enzymes. Ligation was performed using Ligation Mighty Mix (TaKaRa), and recombinant vectors were transformed into competent cells of Escherichia coli (DH5α). The positive clones were extracted and sent for commercial sequencing (Macrogen, Seoul, Korea) to verify the sequences of LhGSTO1 and LhGSTK1.
After confirming the sequences in the pMAL-c5X recombinant plasmids, they were transformed into E. coli BL21 (DE3) competent cells. The recombinant protein was produced and purified by E. coli using the pMAL™ Protein Fusion and Purification System, according to the manufacturer’s instructions (E8200S, NEB). Briefly, cells were induced by 0.3 mM isopropyl β-D-1-thiogalactopyranoside (IPTG; Biosesang, Yongin, Korea) and incubated at 25°C and 200 rpm for 8 h. After incubation, the cells were harvested at 3,500×g for 30 min at 4°C, and the resulting pellets were stored at –20°C. The crude extract was obtained through sonication. The recombinant protein from the crude extract was eluted using an amylose affinity resin (NEB, Ipswich, MA, USA). After protein purification, the eluted fraction was run on 12% Tris-glycine sodium dodecyl sulphate-polyacrylamide gel electrophoresis (SDS-PAGE), and the gel was stained with Coomassie brilliant blue G-250 (Fluka, Paris, France).
The GST enzymatic activity of recombinant LhGSTO1 and LhGSTK1 (rLhGSTO1 and rLhGSTK1) was determined using spectrophotometry with different substrates, according to the method described in a previous study. The four substrates were as follows: 1,2-dichloro-4-nitrobenzene (DCNB; Sigma-Aldrich), 1-chloro-2,4-dinitrobenzene (CDNB; Sigma-Aldrich), 4-nitrophenethyl bromide (4-NPB; Sigma-Aldrich), and 4-nitrobenzyl chloride (4-NBC; Sigma-Aldrich). The assay cocktail contained 1 mM of each substrate, 1 mM reduced GSH (Sigma-Aldrich), 0.1 M phosphate buffer, and 10 μg of rLhGSTO1 and rLhGSTK1. The reaction was carried out in a 96-well plate, and absorbance was measured at the corresponding wavelength (Table 2) using a Multiskan Sky microplate reader.
An agar-well diffusion assay was performed to compare the survival efficacy of transformed E. coli (BL21) with that of the pMAL-c5X vector and transformed E. coli (BL21) with the recombinant plasmids of LhGSTO1 or LhGSTK1 under heavy metal exposure. For the overexpression of the protein, the transformed E. coli were cultured in Luria-Bertani (LB; Miller, WI, USA) broth supplemented with 0.2% glucose until it reached 0.6 absorbance at 600 nm. The proteins were induced with 0.3 mM IPTG. The bacterial cells were spread onto LB agar plates. Subsequently, 3 mm disks were placed in LB agar plates, which were filled with 10 μL of 1 M CdCl2, 1 M CuSO4, and 1 M ZnCl2. The clearance zones were measured after overnight incubation at 37°C.
Heavy metal toxicity assays were performed as described previously (Udayantha et al., 2021). Briefly, fathead minnow (FHM) cells (ATCC, Manassas, VA, USA) were cultured in an L-15 medium (Leibovitz; Sigma-Aldrich) supplemented with 10% fetal bovine serum (Capricorn Scientific, Ebsdorfergrund, Germany) and 1% penicillin-streptomycin (Gibco, Grand Island, NY, USA). The FHM cells were plated at 3 × 10⁴ cells per well and transfected using X-treamGENETM 9 reagent (Roche, Basel, Switzerland) according to the manufacturer’s instructions. The transfected cells were treated with different doses of CdCl2·5H2O (Sigma-Aldrich). After 48 h, 5 mg/mL 3-(4,5-dimethylthiazol-2-yl)-2,5-diphenyl tetrazolium bromide (MTT) solution (VWR Life Science, Lutherville, UK) was added to each well, and the cells were further incubated for 4 h. Then, the existing medium was aspirated, and 100 μL of dimethyl sulfoxide (Sigma-Aldrich) was added to each well. Finally, the absorbance was measured at 540 nm using a Multiskan Sky microplate reader , and cell viability was estimated as described previously (Udayantha et al., 2021).
All experiments were conducted in triplicate, and the data are presented as mean ± SD. To identify significant differences, statistical analysis was performed using the paired-sample t-test or independent-sample t-test when the results between the control and immune induced groups were compared. For comparisons between multiple groups, statistical significance was calculated using a one-way analysis of variance (ANOVA) with post-hoc pairwise comparisons. All statistical analyses were performed using PASW Statistics ver. 18.0 program (SPSS, Chicago, IL, USA).
Results
Nucleotide sequences of LhGSTO1 and LhGSTK1 were identified from the transcriptome database of L. haematocheila established previously. The GenBank accession numbers, number of amino acids (aa), estimated molecular mass, and theoretical isoelectric point are shown in Table 2. According to SignalP, none of the genes contained signal peptides. LhGSTO1 encompassed a thioredoxin-like superfamily domain (N-terminal domain, 3–92 aa) and a C-terminal domain (106–227 aa). Notably, an active-site cysteine residue (Cys30) was confirmed in the N-terminus. GSH-binding sites (G-sites) and substrate-binding pockets (H-sites) were present in the N-terminal and C-terminal regions of LhGSTO1, respectively (Fig. 1A). In contrast, LhGSTK1 comprised only a thioredoxin-like superfamily domain (5–213 aa) and a G-site, with no H-site observed (Fig. 1B).
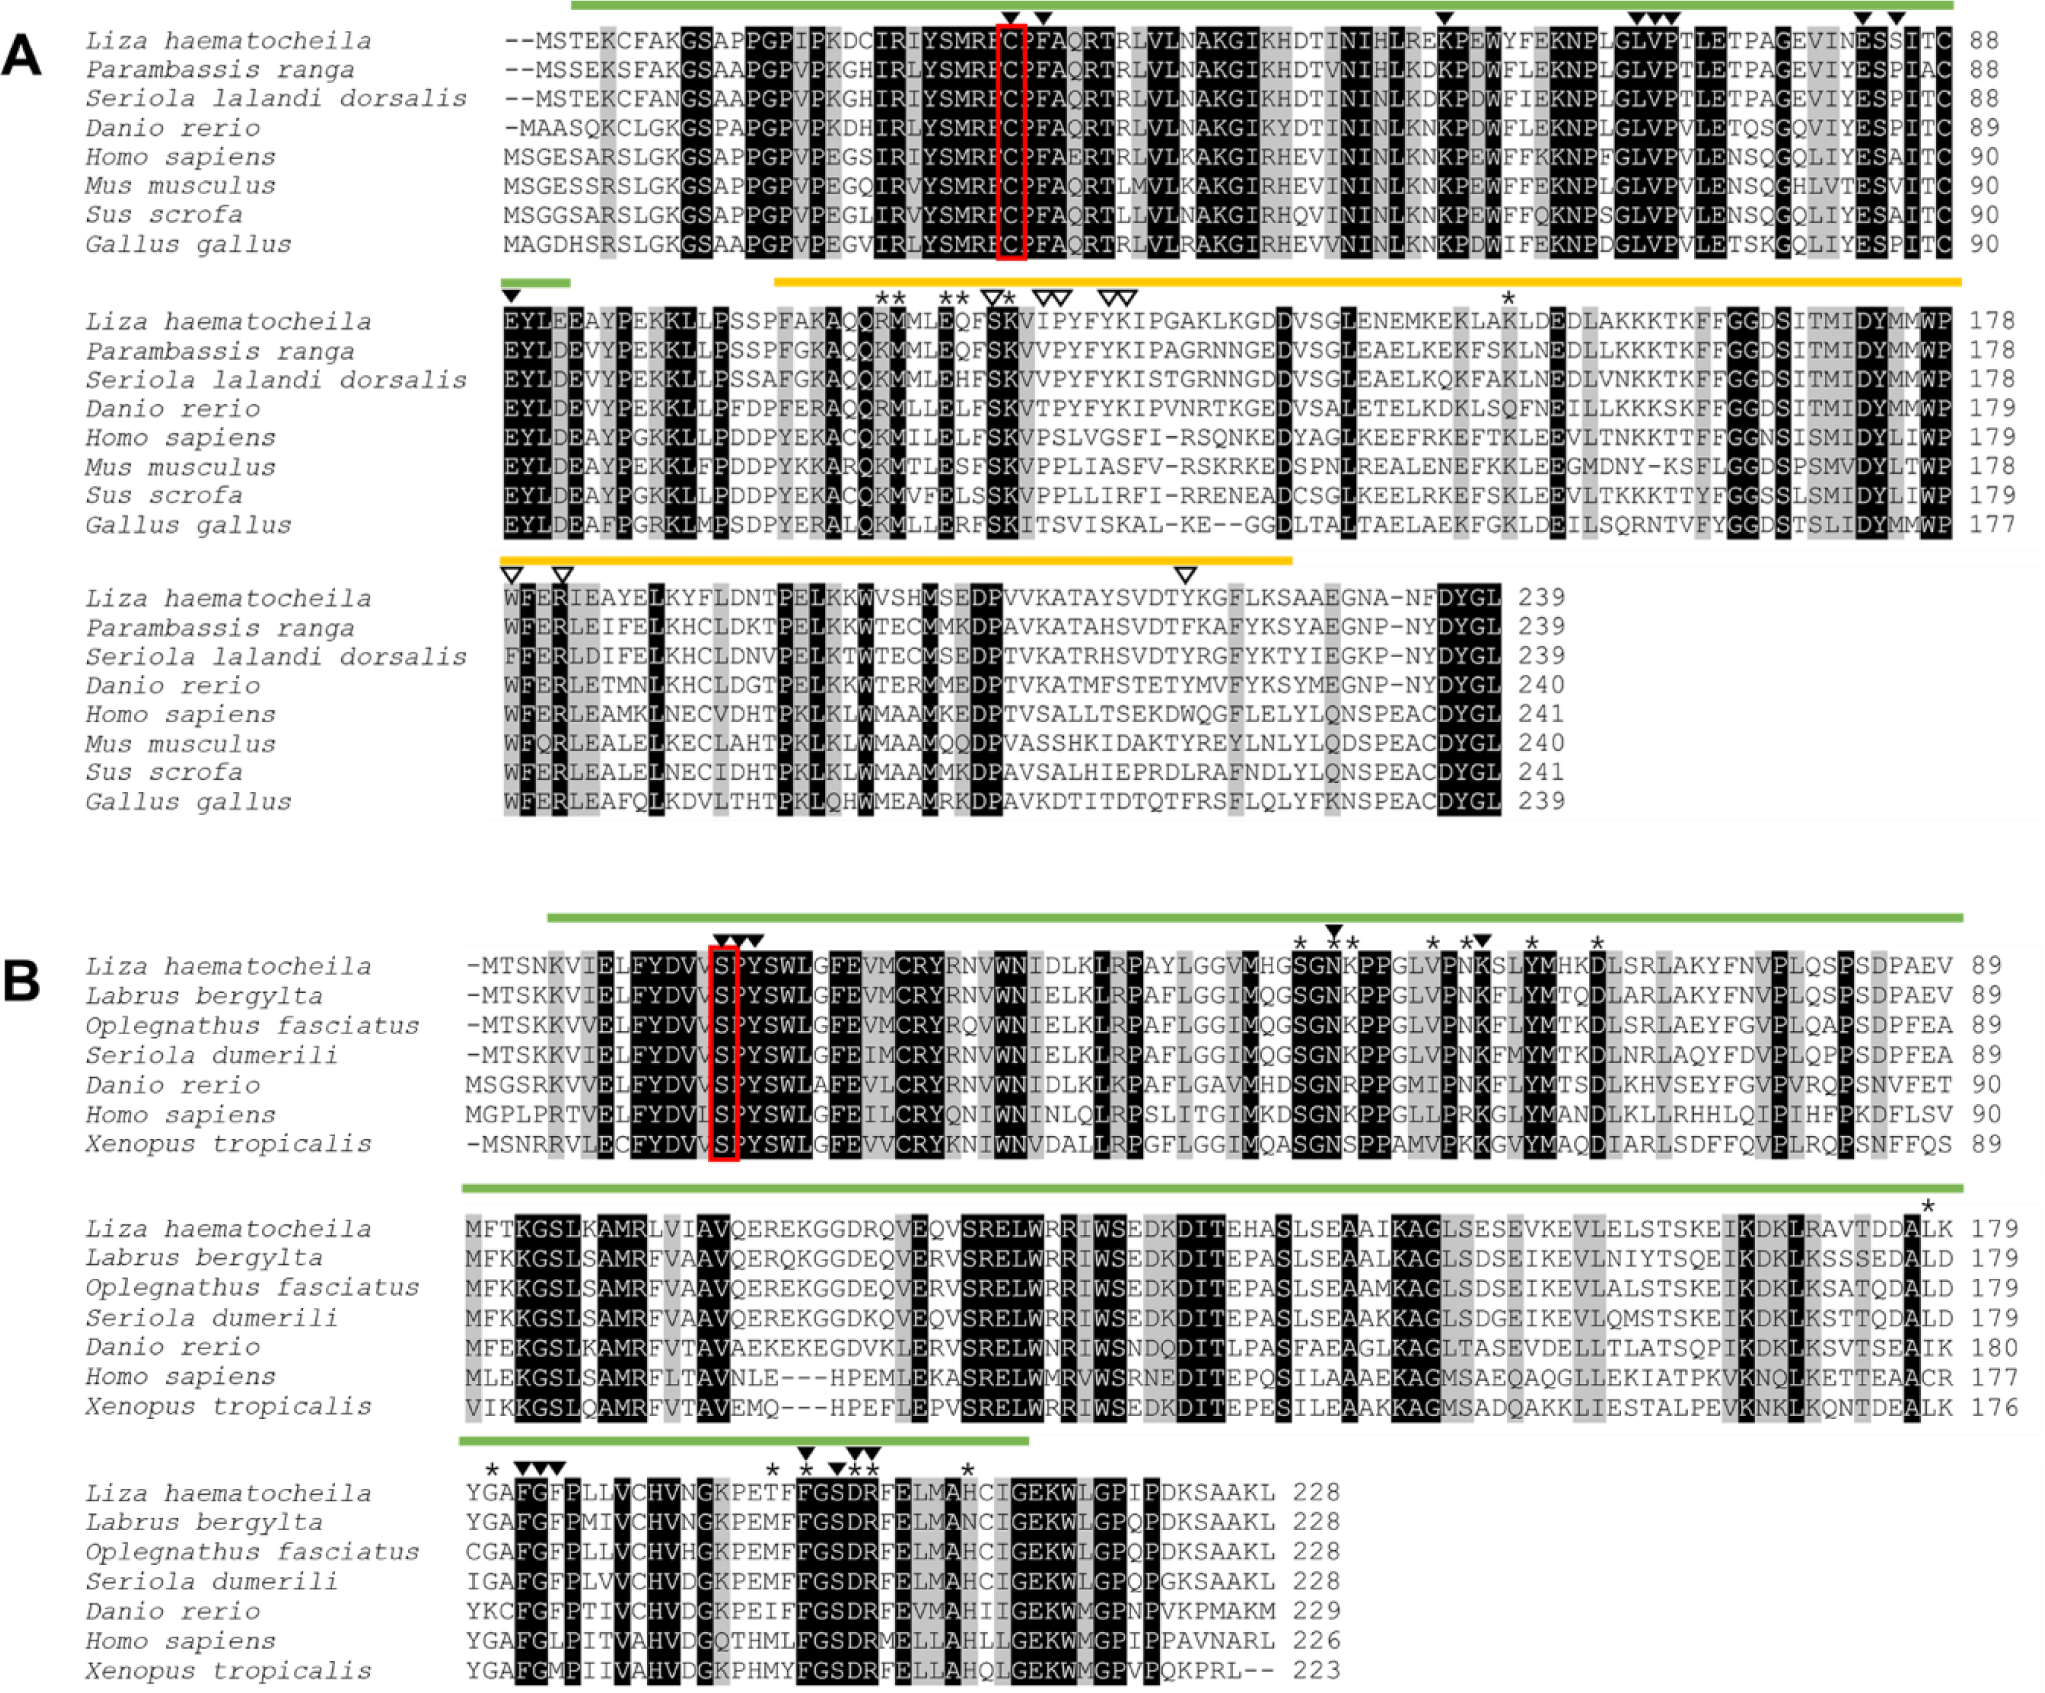
Sequence analysis of LhGSTO1 and LhGSTK1 was performed using PSA and MSA (Table 3 and Fig. 1). Amino acid sequence analysis revealed that LhGSTO1 showed high similarity and identity with GSTO1 orthologs of teleosts, such as Parambassis ranga (87.9%, 78.2%), Scophthalmus maximus (87.4%, 75.7%), and O. niloticus (86.6%, 77.0%). In LhGSTK1, high similarity and identity were observed with GSTK1 orthologs from Labrus bergylta (93.0%, 84.6%), Oplegnathus fasciatus (90.8%, 85.1%), and Seriola dumerili (90.8%, 83.3%). MSA of LhGSTO1 and LhGSTK1, with their homologs, suggested that functional domains, such as the thioredoxin-like superfamily domain in GSTO1 and GSTK1 and the C-terminal domain in GSTO1, were highly conserved across all species (Fig. 1).
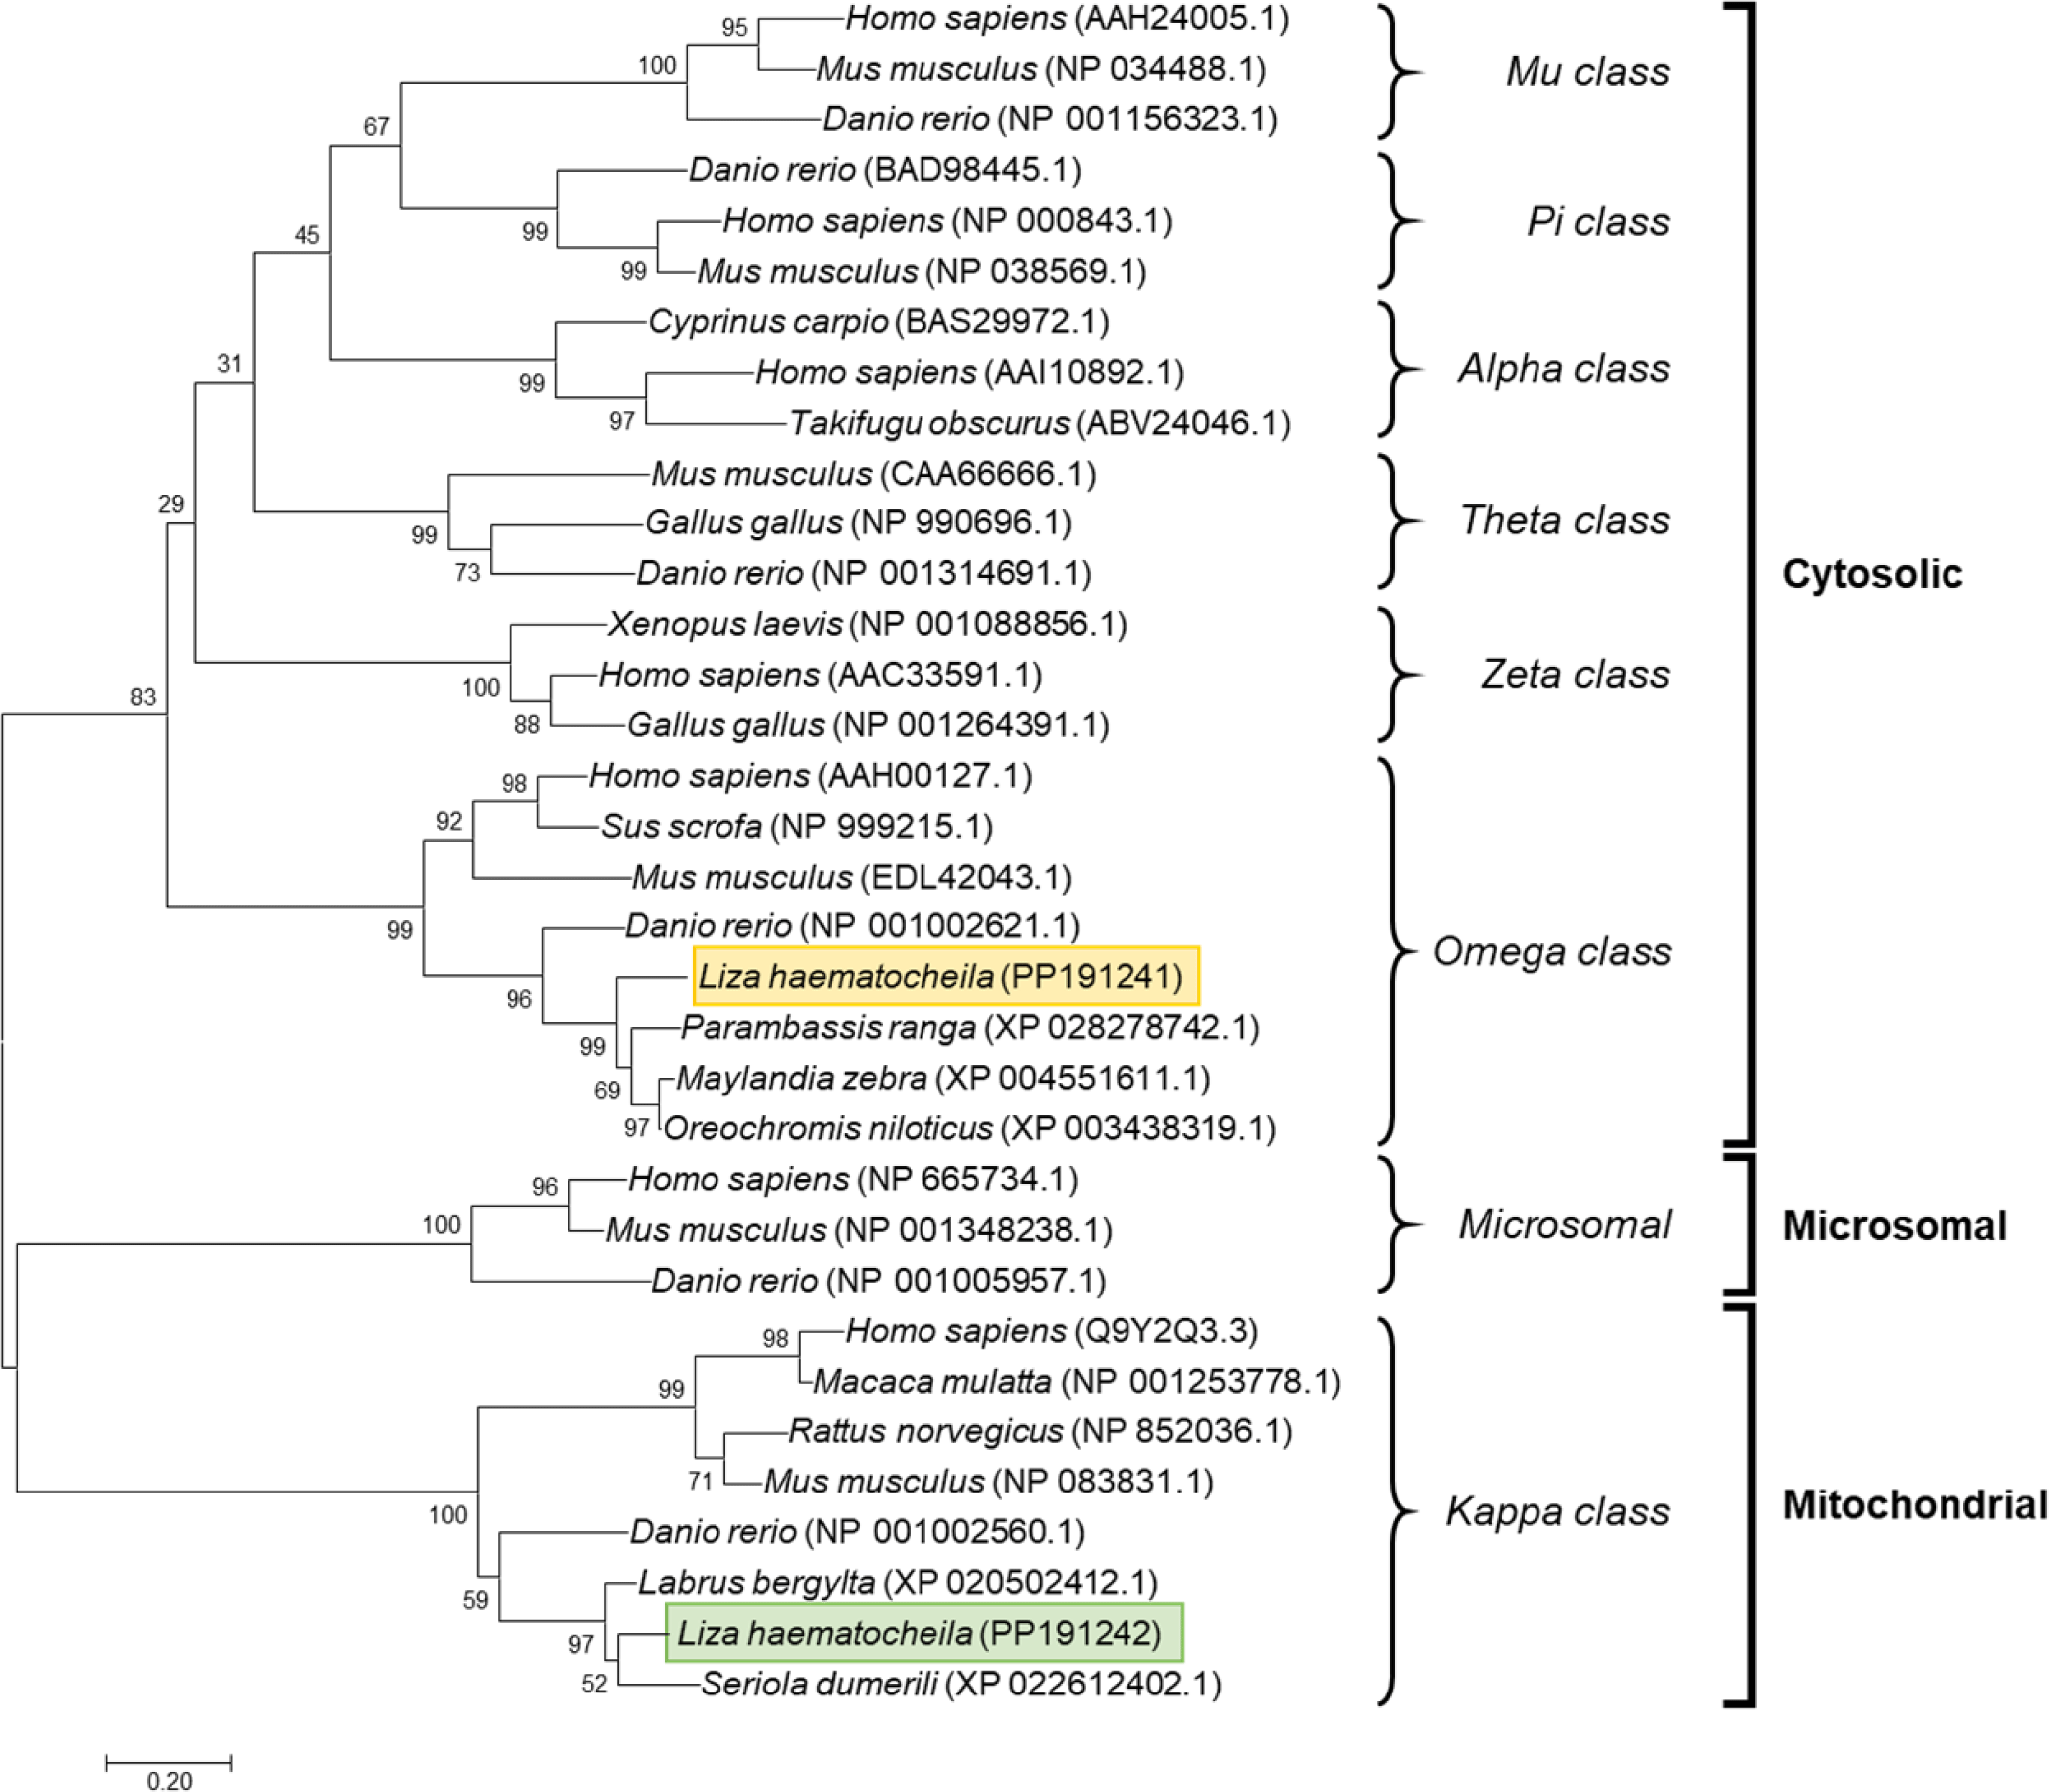
A phylogenetic tree depicting the evolutionary relationships between orthologs was constructed using the amino acid sequences of GSTs from various taxa. The results revealed the formation of eight distinct clades, indicating the genetic divergence of these classes (Fig. 2). Furthermore, branches representing GSTO1 and GSTK1 were observed in both fish and mammalian subclades. LhGSTO1 and LhGSTK1 were clustered together with their respective fish homologs within the tree.
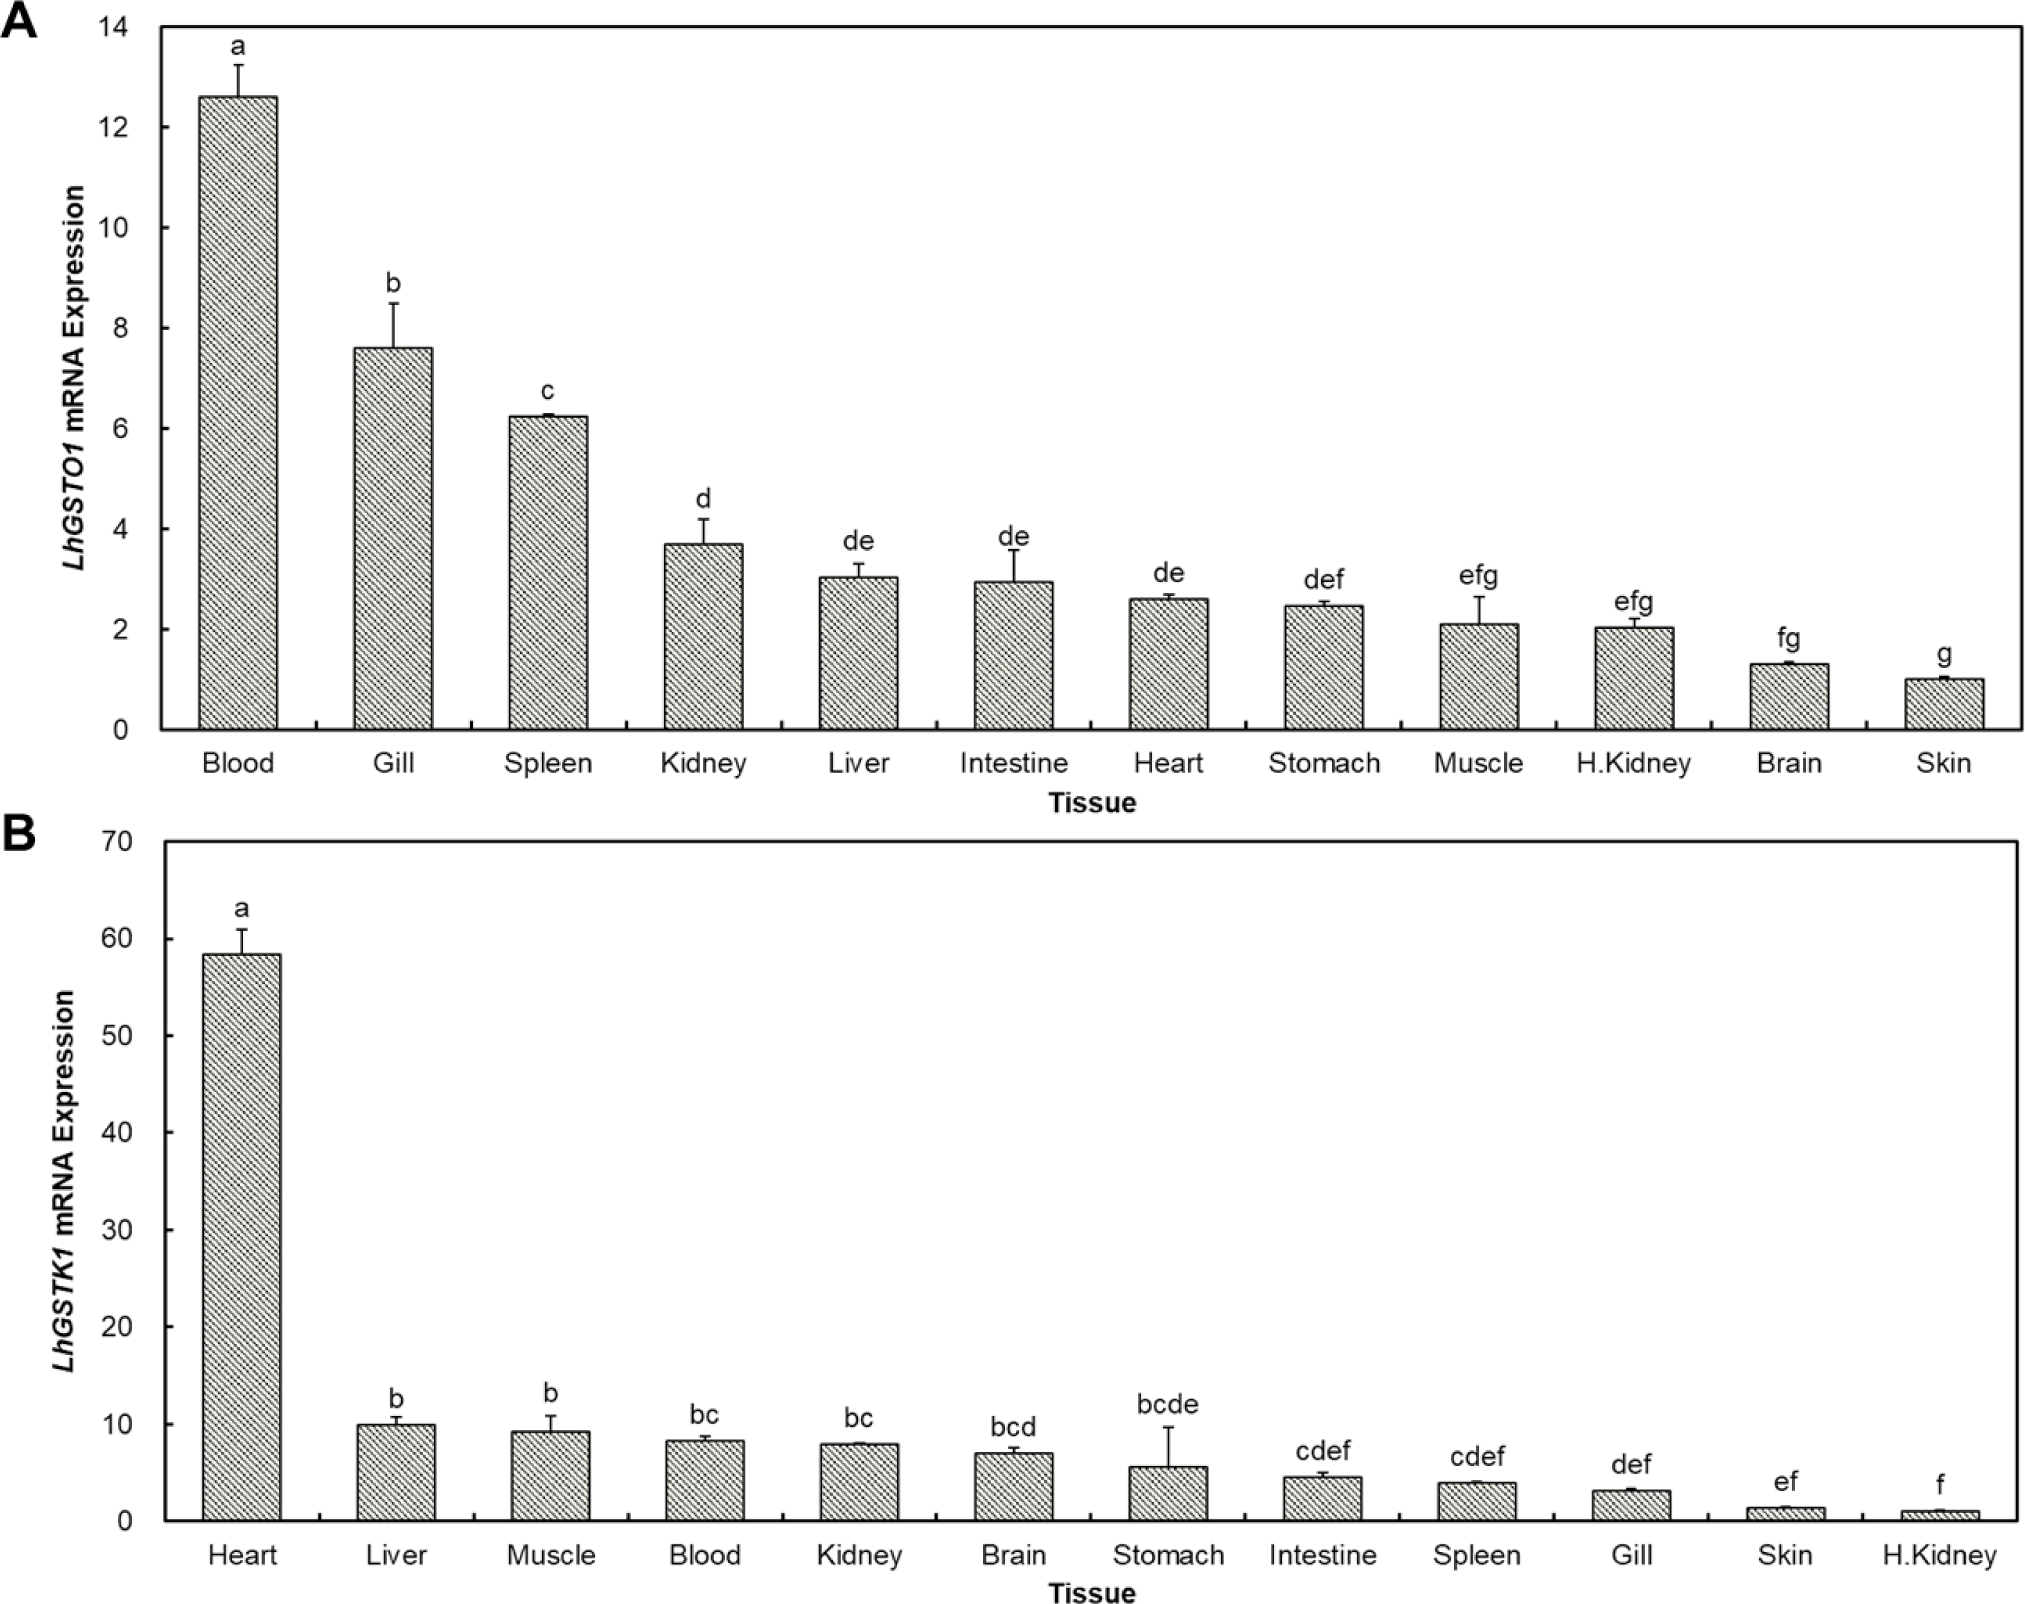
Twelve tissue samples from healthy mullets were used to analyze the tissue-specific expression patterns of LhGSTO1 and LhGSTK1 (Fig. 3). The highest expression levels of LhGSTO1 and LhGSTK1 were observed in the blood and heart, respectively. In contrast, the skin exhibited the lowest expression level for LhGSTO1, whereas the head kidney showed the lowest expression level for LhGSTK1.
To understand the functional roles of LhGSTO1 and LhGSTK1 during immune responses, their temporal expression patterns in the blood tissues of redlip mullet exposed with the three immune stimuli were assessed using qRT-PCR. LhGSTO1 transcripts significantly increased at one or two time points after stimulation with all three stimulants (Fig. 4). Nevertheless, in L. garvieae infection, significant downregulation of expression was simultaneously observed at 6 and 24 h post-challenge. Similarly, the transcription of LhGSTK1 was significantly upregulated upon LPS, poly I:C, and L. garvieae injections, especially at later time points. Downregulation of LhGSTK1 transcription was also observed 6 h after L. garvieae challenge.

rLhGSTO1 and rLhGSTK1 were expressed as maltose-binding protein (MBP) fusion proteins in E. coli cells. Their purity and molecular weight were confirmed using 12% SDS-PAGE (Fig. 5). The target proteins were present in the soluble fraction and were shown at expected sizes (42.5 kDa for MBP, 69.9 kDa for rLhGSTO1, and 68.2 kDa for rLhGSTK1).

Four different substrates, DCNB, CDNB, 4-NPB, and 4-NBC, were used to assess the GST activity of rLhGSTO1 and rLhGSTK1 (Table 4). The results indicated that both proteins exhibited specific activity toward the CDNB substrate, with values of 2.65 ± 0.46 and 13.52 ± 2.39 μmol/min/mg, respectively. No activity was observed in the reactions with DCNB, 4-NPB, or 4-NBC substrates for either recombinant protein. As a negative control, the MBP fusion protein showed no activity toward any substrate.
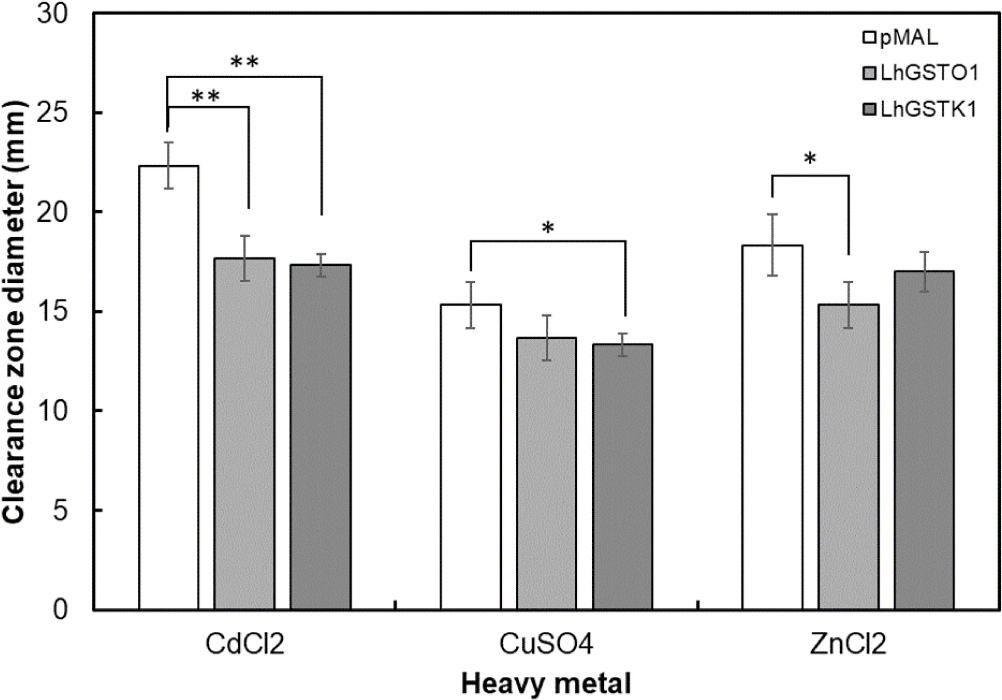
To evaluate the detoxification activities of rLhGSTO1 and rLhGSTK1 under heavy metal treatment, a disk diffusion assay was performed in E. coli cells transformed with recombinant expression vectors. The results revealed that both proteins exhibited notable detoxification effects toward heavy metals (Fig. 6). The clear zones of the pMAL-c5X vector-transformed cells were larger than those of rLhGSTO1- and rLhGSTK1-expressing cells. Among the three heavy metals, CdCl2 showed the highest toxicity in E. coli cells with the largest clearance zones, whereas both rLhGSTO1 and rLhGSTK1 exhibited significant detoxification effects. However, in the ZnCl2 treatment, a significant detoxification effect was observed only for rLhGSTO1, whereas only rLhGSTK1 exhibited a significant detoxification of CuSO4.
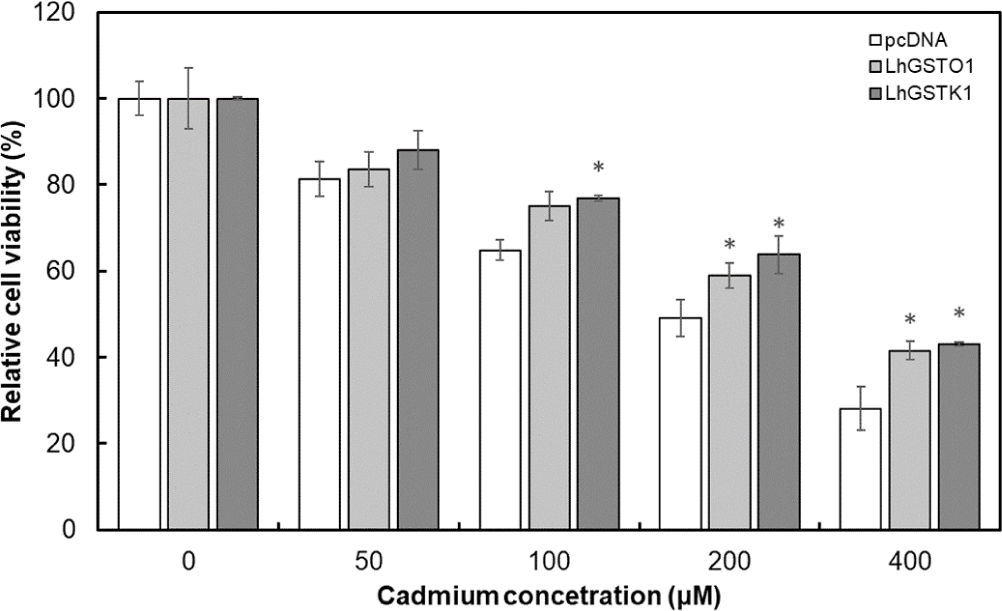
To further verify the cellular protective effects, LhGSTO1 and LhGSTK1 were overexpressed in FHM cells, followed by treatment CdCl2 with varying concentrations. The MTT cell viability assay revealed that the viability of FHM cells exposed to CdCl2 decreased in a concentration-dependent manner (Fig. 7). Nevertheless, cells overexpressing LhGSTO1 and LhGSTK1 exhibited higher viability compared to the control, especially at higher concentrations (200 and 400 μM), where significant differences were observed for both proteins.
Discussion
Fish are profoundly affected by the aquatic environment and are constantly exposed to various biotic and abiotic factors, such as pathogens, oxygen deficiency, and pollutants. To defend against these external factors, host cells produce numerous metabolic enzymes to maintain homeostasis. Among these enzymes, GSTs function as phase II detoxification enzymes that conjugate xenobiotic substrates with GSH to transform them into more water-soluble and less toxic forms (Hayes et al., 2005). Although GSTs have been extensively studied in mammals and non-mammalian organisms, including birds, insects, plants, and microbes, reports on GSTs in fish are limited, and studies on the roles of GSTs in mullet are scarce. In this study, we conducted in silico and functional characterization of two GST genes in redlip mullet.
Generally, GSTs form dimers (homodimers or heterodimers) with identical chains that share a common fold, despite their low amino acid sequence identity (Allocati et al., 2018). As described in previous reports, most GSTs have a similar structure with two distinct domains: the N-terminal thioredoxin fold and the C-terminal composed of α-helical structures (Oakley, 2011). The N-terminal domain provides a binding site for GSH (G-site), which interacts specifically with GSH through hydrogen bonding and catalyzes nucleophilic attacks (Allocati et al., 2018). The H-site located in the C-terminal domain catalyzes the conjugation reaction between GSH and electrophilic substrates (Andújar-Sánchez et al., 2005). The H-site varied in chemical characteristics and shape between the GST classes. Structural analysis revealed that both LhGSTO1 and LhGSTK1 contained a G-site in the thioredoxin domain, whereas the H-site was absent in LhGSTK1, which contained a disulfide bond formation protein A (DsbA) domain. The DsbA domain in the kappa class of GSTs is represented by a thioredoxin domain with an inserted α-helical structure. This is a conserved feature of cytosolic GSTs, which share similar substrate specificity across classes. Since the domain structures were only predicted using bioinformatics tools, additional assays are required to uncover the primary functions of LhGSTO1 and LhGSTK1.
Both GSTO1s and GSTKs are expressed in a broad range of tissues, reflecting their fundamental roles in cellular metabolism (Board & Menon, 2013). However, their spatial expression patterns differ, implying distinct in vivo functions in various animal tissues. Moreover, previous reports have indicated that certain GST classes exhibit universal tissue distribution profiles, whereas others display variable patterns across different species. Research in humans and mice has revealed a high expression of mammalian GSTO genes in the liver and heart (Whitbread et al., 2005). However, species-specific patterns of GSTO have been observed in fish and invertebrates. For instance, in the big-belly seahorse (Hippocampus abdominalis), the pouch showed the highest GSTO1 expression, whereas the liver and heart exhibited the lowest expression (Udayantha et al., 2021). In black rockfish (Sebastes schlegelii), GSTO1 was highly expressed in blood cells (Jayasinghe et al., 2016). River pufferfish (Takifugu obscurus) and disk abalone (Haliotis discus discus) display a uniform distribution of GSTO1 among their tissues (Kim et al., 2010; Wan et al., 2009). In our study, LhGSTO1 exhibited the highest expression in the blood, followed by the gills and spleen, suggesting specific functional roles in redlip mullet tissues. In mice and rats, GSTK genes were highly expressed in the heart, kidneys, and liver (Jowsey et al., 2003). In camels, the highest GSTK expression was observed in the liver and kidneys (Ataya et al., 2014). Big-belly seahorse research has indicated high GSTK expression in the kidneys, liver, and heart (Samaraweera et al., 2019). Additionally, GSTK in the black scorpion has been reported to be highly expressed in the liver (Kim et al., 2010). These findings are consistent with the high expression levels of LhGSTK1 mRNA in the heart and liver, indicating that the function of GSTK may be conserved across species.
To explore their involvement in the innate immune response, the mRNA expression levels of LhGSTO1 and LhGSTK1 were assessed in the blood after stimulation of LPS, poly I:C, and live L. garvieae, respectively. The significant induction of two LhGSTs in response to all three stimulants indicate that they may contribute to immune responses via their antioxidant capabilities. LPS is an outer membrane component found in Gram-negative bacteria, known to trigger antimicrobial immune activation via the Toll-like receptor 4 (TLR4)-mediated signaling pathway. When exposed to LPS treatment, immune cells such as macrophages in the blood of redlip mullet are activated, leading to the release of inflammatory cytokines and chemokines. This activation is followed by the generation of reactive nitrogen species and ROS, which aid in eliminating engulfed pathogens. During this process, the expression of GSTs is stimulated to detoxify ROS and shield cells from oxidative stress and damage. In clam (Venerupis philippinarum), the expression level of pi class GST (GSTP) was significantly upregulated following Vibrio anguillarum challenge (Li et al., 2012), where it regulated nuclear factor-kappa B (NF-κB) activation through association with tumor necrosis factor receptor-associated factor 2 (TRAF2), playing a crucial role in immunity and inflammation (Wu et al., 2006). In shrimp (Palaemon carinicauda), GST delta (GSTD) has been reported to respond dramatically to the challenges of V. anguillarum (Duan et al., 2013). Studies in mammalian models have demonstrated that GSTO modulates macrophage metabolism through the LPS/TLR4 signal transduction pathway during bacterial phagocytosis (Menon et al., 2015). GSTO1-deficient macrophages exhibit significantly diminished nitric oxide production following LPS treatment (Menon et al., 2015).
Poly I:C is a synthetic analog of viral dsRNA commonly used to mimic viral infection. Poly I:C triggers immune signaling pathways, particularly those involved in the antiviral response, ultimately leading to an increase in ROS levels within cells. ROS can induce apoptosis in cells and hinder the spread of viruses to neighboring cells. Antioxidant enzymes, such as GSTs, play a crucial role in preventing the overproduction of toxic ROS and excessive tissue damage during antiviral defense. In shrimp (P. carinicauda), white spot syndrome virus infection significantly induced GSTD expression (Duan et al., 2013). In humans, the GSTO polymorphism is closely associated with the infection stage of the hepatitis B virus (Shaban et al., 2016). In big-belly seahorses (H. abdominalis), recombinant GSTO1 has demonstrated inhibitory activity against viral replication of viral hemorrhagic septicemia virus (Udayantha et al., 2021).
L. garvieae is a Gram-positive bacterium that infects a wide range of fish species. Rainbow trout infected with L. garvieae exhibited significantly elevated CRP levels (Khosravi et al., 2018), which leads to the induction of pro-inflammatory cytokines, including interleukin-1, tumor necrosis factor-α (TNF-α) (Sonawane & Nimse, 2017). Similarly, the transcriptome analysis of grey mullet (Mugil cephalus) under L. garvieae infection revealed the remarkable activation of TLR, NF-kappa B and TNF signaling pathways (Byadgi et al., 2016). Additionally, a previous study in redlip mullet reported a significant upregulation of mRNA expression for antioxidant enzymes following L. garvieae infection (Kim et al., 2019). The increased expression of GST and other antioxidant genes may play a role in maintaining the cellular homeostasis of inflammation microenvironment during the immune response to L. garvieae infection.
To enhance our understanding of the biological functions of LhGSTO1 and LhGSTK1, we conducted enzymatic assays using four substrates. Both rLhGSTO1 and rLhGSTK1 reacted exclusively in the presence of the CDNB substrate. Originally, CDNB was a benzene derivative that served as a universal substrate for numerous GSTs (Board et al., 2000). Various studies have shown that GSTO1 in marine organisms exhibits specific activity toward CDNB, as observed in the big-belly seahorse, coho salmon (Oncorhynchus kisutch), and Pacific oyster (Crassostrea gigas) (Espinoza et al., 2013; Trevisan et al., 2016; Udayantha et al., 2021). Nevertheless, recombinant GSTO1 in humans shows activity not only with CDNB but also with 4-NPB and 4-NBC (Board et al., 2000). GSTK was initially classified within the theta class of GSTs because of its low N-terminal sequence similarity compared to other recognized GST classes, as well as its utilization of a serine residue for the active site (Zeitoun & Mehana, 2014). Despite having an atypical primary structure, GSTK purified from rats exhibited significant GSH conjugation activity toward CDNB but showed no catalytic activity with other substrates, such as DCNB (Harris et al., 1991). The observed GST enzymatic activities of rLhGSTO1 and rLhGSTK1 suggest their potential involvement in cellular detoxification mechanisms, possibly through the conjugation of GSH to xenobiotic compounds.
To investigate the functional roles of LhGSTO1 and LhGSTK1 in heavy metal detoxification, we examined their effects on cell viability after treatment with three chemicals representing common sources of heavy metal pollution in marine environments. In the agar-well diffusion assay in E. coli cells, LhGSTO1 and LhGSTK1 showed a higher detoxification ability against CdCl2 than against CuSO4 and ZnCl2. Additionally, the MTT assay conducted on FHM cells further confirmed the detoxification abilities of LhGSTO1 and LhGSTK1 under Cd exposure. Cu is naturally present in living organisms and serves as an essential trace component of the body. However, excessive Cu intake can cause neurological disorders, hepatic necrosis, and hypertension (Zatta & Frank, 2007). Zn is also a vital component of fundamental cellular functions, mediating a wide variety of enzyme activities and participating in multiple metabolic processes. However, excessive Zn intake has been reported to cause adverse effects in humans, such as anemia and impairment of innate immunity (Jeng & Chen, 2022). Cd is a trace metal that is considered one of the most toxic heavy metals, even at extremely low concentrations. Cd exposure can disturb the balance of bioelements and induce the generation of ROS, leading to oxidative damage (Patra et al., 2011). This, in turn, induces renal dysfunction, neurological disorders, and male infertility in mammalian models. Heavy metals, which originate from industrial, domestic, and agricultural activities, are discharged into the ocean, causing marine pollution that adversely affects the health of marine organisms. GSTs have been extensively documented for their significant role in heavy metal detoxification in marine organisms. In Brazilian flounder (Paralichthys orbignyanus) exposed to a polluted site, GST activity was higher than that in flounder from non-polluted sites due to DNA repair mechanisms against clastogenic agents (Amado et al., 2006). In Atlantic cod (Gadus morhua), GSTs were upregulated due to the synthesis of antioxidant enzymes induced by methylmercury (Yadetie et al., 2013). Similarly, in spotted snakeheads (Channa punctatus), Javed et al. suggested that GSTs can be induced to respond to the imbalance between ROS production and neutralization due to heavy metal exposure (Javed et al., 2017). Our results, along with existing research on fish GSTs, further elucidate the critical role of these enzymes in marine organism adaptation and survival in heavy metal-polluted environments. Future studies exploring the interactions between fish GSTs and diverse pollutants could provide valuable insights into their detoxification potential and ecological significance.
Conclusion
In the present study, we identified and investigated the functions of GSTO1 and GSTK1 in redlip mullet. Bioinformatic analysis revealed that these enzymes share conserved domains and active sites. Functional characterization demonstrated that both LhGSTO1 and LhGSTK1 were transcriptionally responsive to immune stimulation. Furthermore, recombinant LhGSTO1 and LhGSTK1 exhibited heightened detoxification activity, particularly against heavy metals, such as Cd. Therefore, we suggest that LhGSTO1 and LhGSTK1 play essential roles in the innate immune response against invading pathogens and serve as crucial components in the detoxification mechanism against environmental xenobiotics.


