Introduction
Krill, crustacean zooplankton members of the Euphausiacea order, are central to linking primary producers with mid- to upper-trophic levels in Antarctic marine ecosystems (Everson, 2000). Antarctic krill (Euphausia superba) serve as a pivotal indicator species in these ecosystems and are significant fishery resources (Everson, 2000). The Commission for the Conservation of Antarctic Marine Living Resources continuously monitors Antarctic krill biomass for both conservation and resource utilization (Watkins et al., 2004). On the coast of the Southern Ocean, ice krill (Euphausia crystallorophias) predominate, substituting Antarctic krill and supporting neritic marine ecosystems (La et al., 2015a). Compared to Antarctic krill, research on ice krill biomass and spatial distribution is less extensive, largely due to the difficulty of accessing their high-latitude coastal habitats, often obstructed by sea ice. Hence, understanding the spatial distributions of both krill species are crucial for understanding Antarctic marine ecosystems across the open and coastal waters of the Southern Ocean.
Hydroacoustic systems, complemented by net sampling, have been widely used in examining the spatiotemporal distribution of marine organisms across wide areas (Lawson et al., 2008). Because marine organisms exhibit different acoustic scattering properties depending on species shape, size, orientation, and biological characteristics, it is possible to identify acoustic signals from fish and zooplankton using target strength (TS, in dB re 1 m2) variation of the interested organisms (Kang et al., 2002). The stochastic distorted-wave Born approximation (SDWBA) model is a standard model for understanding the TS of krill (SC-CAMLR, 2005), which assumes the krill body shape as a discrete cylinder and stochastically calculates the scattering properties according to the density contrast (g), sound speed contrast (h), fatness, and variations in orientation (Calise & Skaret, 2011). While TS research on krill using the SDWBA model has predominantly focused on Antarctic krill (Calise & Skaret, 2011; Conti & Demer, 2006), the TS characteristics of ice krill remain less explored (La et al., 2015b).
Given the distinct characteristics of ice krill and Antarctic krill in terms of prey preferences, developmental stages, and size distribution (Sala et al., 2002), these species may differ not only in their density and sound speed contrasts (Chu & Wiebe, 2005), but also in their size, fatness, and orientations. Such variations may result in distinct ΔTS patterns, which directly affect for the acoustic identification of these species. Therefore, we analyzed the ΔTS characteristics of both krill species employing the SDWBA model.
Materials and Methods
The Stochastic distorted-wave Born approximation (SDWBA) model was used to examine ΔTS variations for key variables (length, shape, density and sound speed contrasts, fatness, and orientation distributions) that affect the TS of Antarctic krill and ice krill. Of the key variables used in the SDWBA model, the same values were used as in Table 1 of Calise & Skaret (2011), except for density and sound speed contrasts, fatness, frequencies ranges, and orientation. The density contrast used in the SDWBA model in this study are based on the measured values of 1.0000 and 1.0279 (Chu & Wiebe, 2005) and 1.0357 (Foote et al., 1990) for Antarctic krill and ice krill, respectively, and the sound speed contrasts of 1.0279 (Foote, 1990) and 1.0180 and 1.0480 (Chu & Wiebe, 2005). The fatness was simulated in increments of 0%, 10%, 20%, 30%, and 40%, and for the distribution of krill orientations, the literature values of N (−20°, 28°), N (−8°, 9°), N (0°, 27°), and N (11°, 4°) for Antarctic and ice krill were used (Conti & Demer, 2006; La et al., 2015a; Lawson et al., 2006; SC-CAMLR, 2010). For the SDWBA model simulation, krill lengths were selected in 2 mm intervals ranging from 4 mm to 60 mm, encompassing the length distributions of both Antarctic krill and ice krill. The differentiation between the two krill species was made based on the criteria found in the literature (Sala et al., 2002), categorizing individuals less than 35 mm as ice krill and those greater as Antarctic krill. The variations in ΔTS were analyzed for lengths of 10, 20, 30, 40, 50, and 60 mm. Additionally, the study investigated the variation in multiple frequency differences, including ΔTS120–38 kHz, ΔTS120–70 kHz, ΔTS200–38 kHz, ΔTS200–70 kHz, and ΔTS200–120 kHz, at commonly used frequencies for krill acoustic identification: 38, 70, 120, and 200 kHz.
Results and Discussion
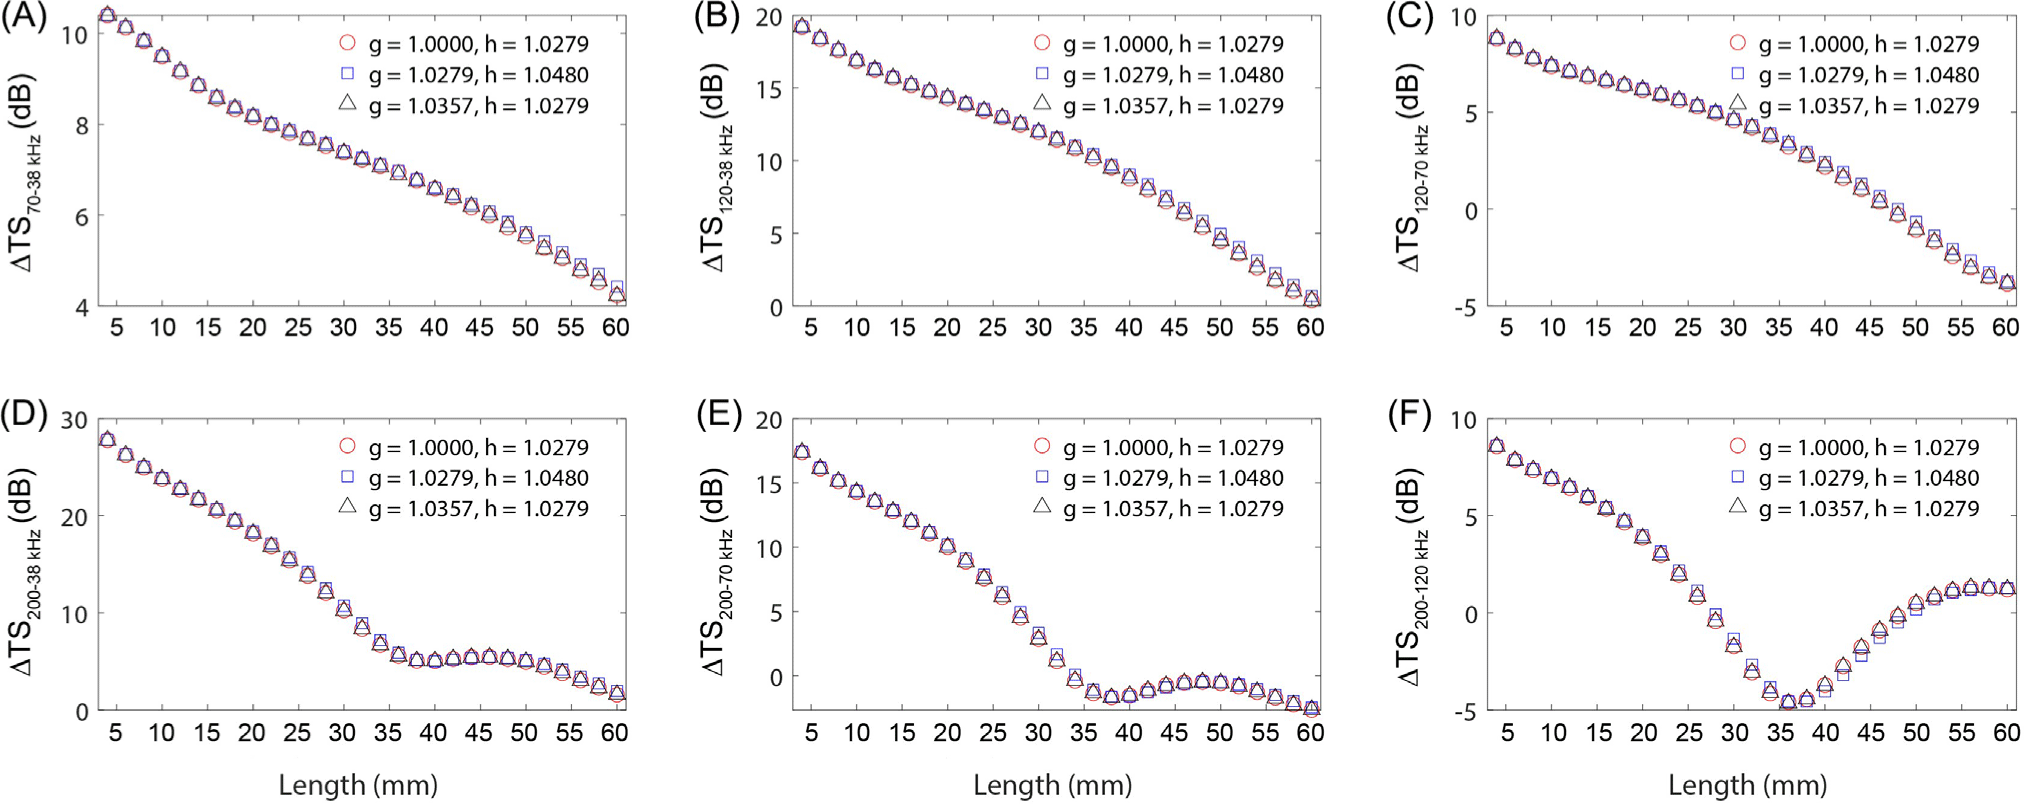
The effects of density and sound speed contrasts parameters on ΔTS at multiple frequencies were examined. For this purpose, the density and sound speed contrasts for Antarctic krill were set at observed values (g = 1.0279, h = 1.0480; g = 1.0357, h = 1.0279) and for ice krill at (g = 1.0000, h = 1.0180) (Chu & Wiebe, 2005; Foote et al., 1990). Krill fatness was fixed at 40%, and the orientation distribution was established at N (−20°, 28°) (SC-CAMLR, 2010). The multi-frequency difference in density and sound speed contrasts showed a linear decrease with increasing length for Δ TS70–38 kHz, Δ TS120–38 kHz, and Δ TS120–70 kHz (Fig. 1A–1C). For ΔTS200–38 kHz and ΔTS200–70 kHz, the difference declined with lengths of 4–40 mm, escalated with lengths of 40–50 mm, and fell again for lengths > 50 mm (Fig. 1D–1E). At ΔTS200–120 kHz, we observed changes in the multi-frequency difference based on the length of 36 mm (Fig. 1F). Variations in density and sound speed contrasts can significantly influence acoustic scattering characterization in zooplankton through acoustic scattering models, TS calculations, and biomass estimates (Stanton & Chu, 2000). Seasonal changes, such as increased lipid composition in zooplankton during winter for energy storage (Campbell & Dower, 2003), can alter density contrast, and fluctuating water temperatures can modify sound speed contrast (Forman & Warren, 2010). Our study revealed that TS patterns when density and sound speed contrasts were set at 1.0357 and 1.0480, respectively, differed markedly from other cases, underscoring these contrasts as key factors in krill acoustic signal identification. Therefore, accurately determining the density and sound speed contrasts for the target species is critical.

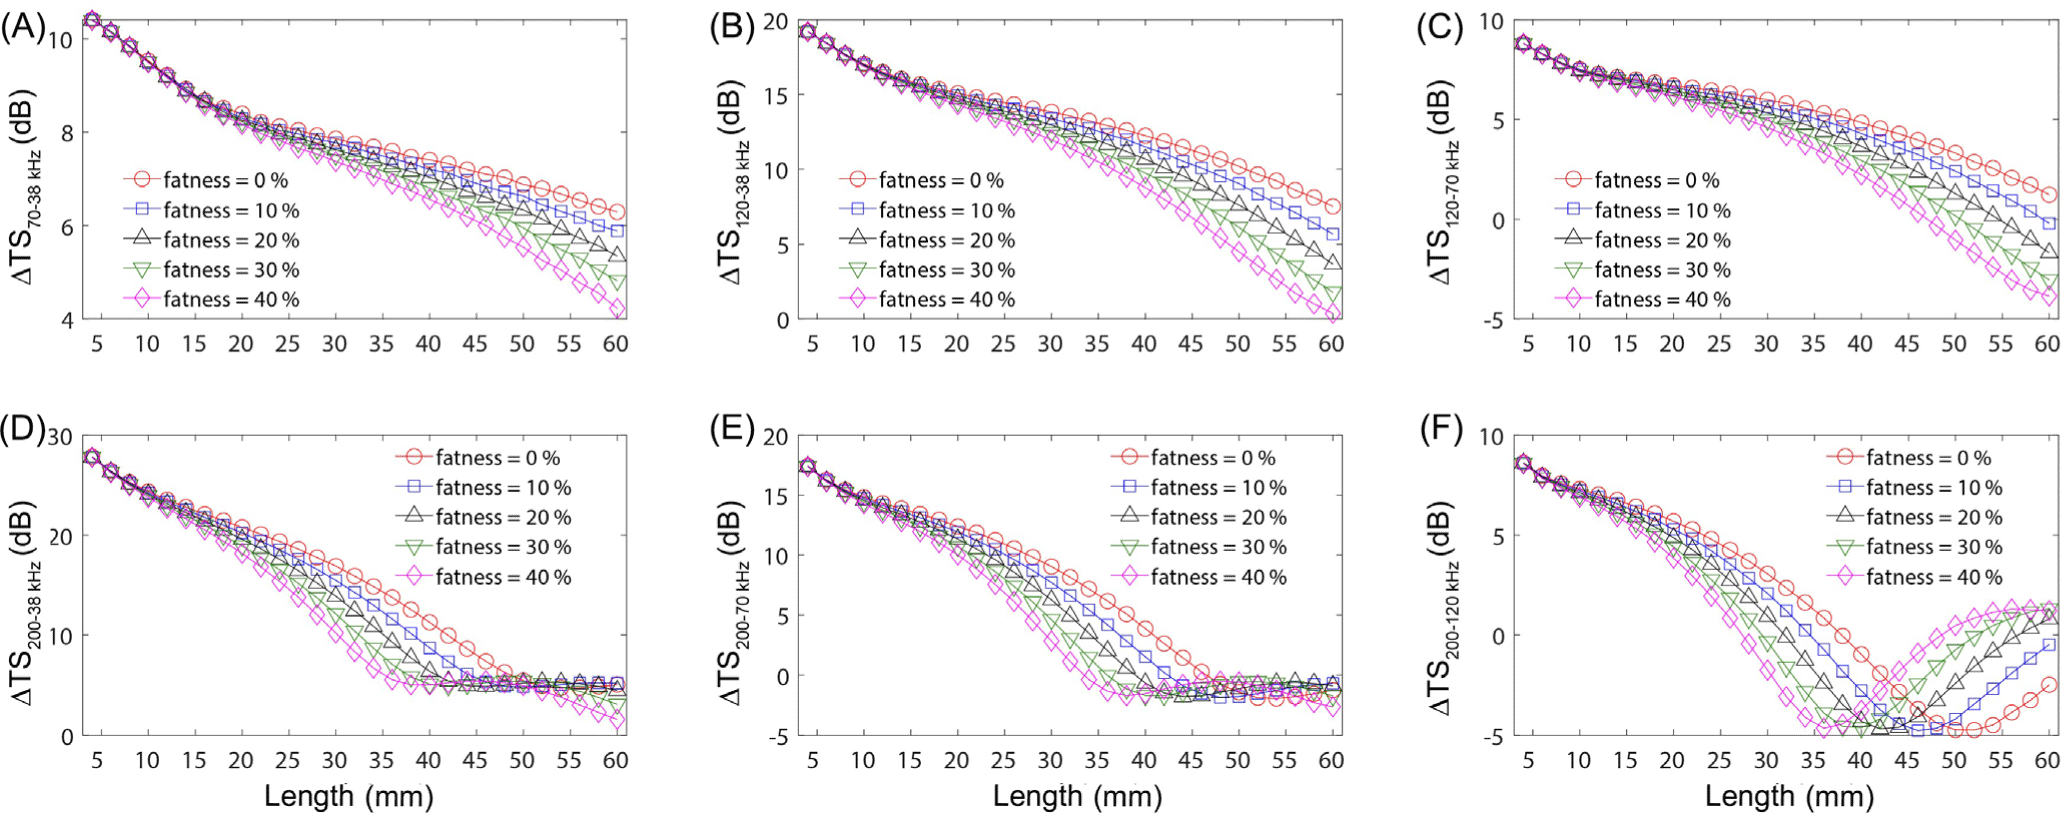
The effects of fatness parameter on ΔTS at multiple frequencies were confirmed. For this analysis, krill fatness was set at 40%, with density and sound speed contrasts at 1.0357 and 1.0279, respectively, and orientation at N (−20°, 28°) to determine the multi-frequency differences (Fig. 2). We observed that multi-frequency differences in krill fatness reduced with an increase in length for ΔTS70–38 kHz, ΔTS120–38 kHz, and ΔTS120–70 kHz (Fig. 2A–2C). Additionally, the variation in multi-frequency differences amplified with longer lengths and higher fatness. The pattern for ΔTS200–38 kHz and ΔTS200–70 kHz showed a decline with increasing length, an increase between lengths of 40 and 56 mm, and then a subsequent decrease (Fig. 2D–2E). At the same krill length (excluding lengths < 12 mm), the impact of fatness on the multi-frequency difference was least pronounced at 50 mm and 56 mm for ΔTS200-38 kHz and ΔTS200–70 kHz, respectively.

The influence of fatness was most evident at ΔTS200–120 kHz (Fig. 2F). Here, the pattern of ΔTS at multiple frequencies, typically decreasing with increasing krill length, shifted at fatness levels of 0%, 10%, 20%, 30%, and 40% for krill lengths of 52, 48, 44, 40, and 36 mm, respectively. In essence, higher fatness altered the ΔTS patterns at comparatively shorter krill lengths. TS variations due to fatness were more significant at larger lengths than at smaller ones. Given that the length distribution of summer Antarctic krill is longer than that of ice krill (Sala et al., 2002), this implies that fatness differences play a more vital role in identifying the acoustic signals of Antarctic krill compared to those of ice krill.
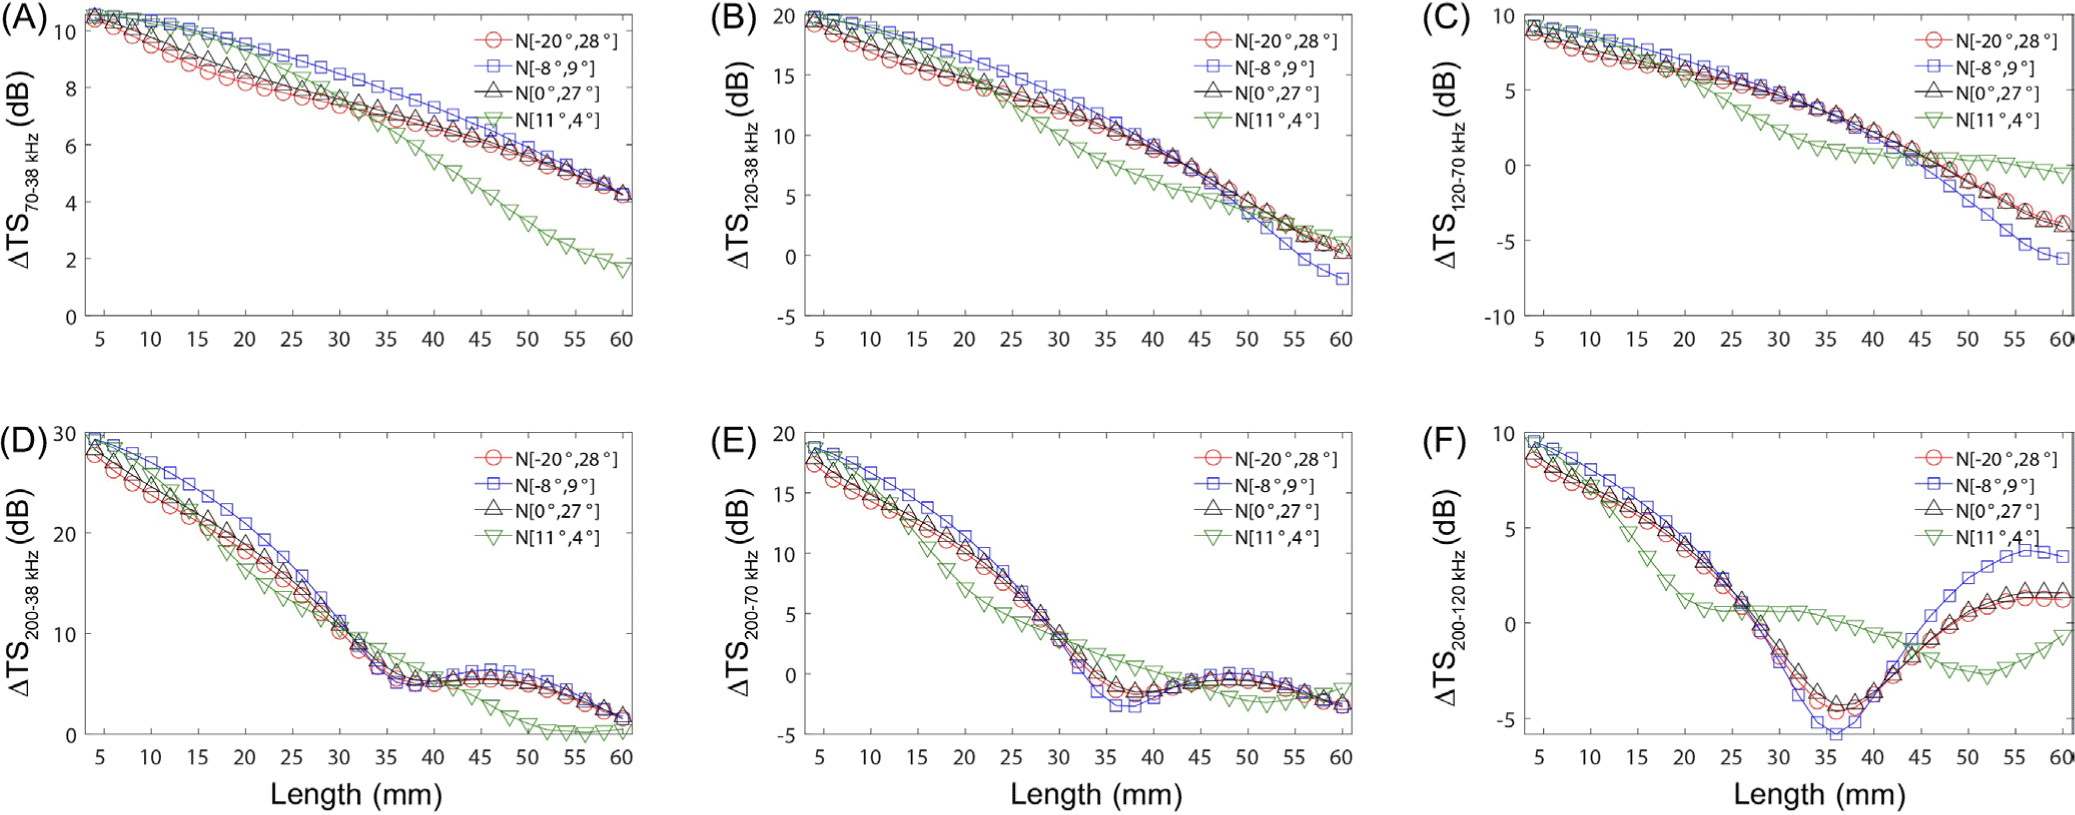
The effects of orientation parameter on ΔTS at multiple frequencies were confirmed. For this analysis, the fatness was set to 40%, and the density and sound speed contrasts were set to 1.0357 and 1.0279, respectively, to calculate the multi-frequency difference. Overall, the length-specific ΔTS in krill according to the distribution of orientations were similar for N (−20°, 28°), (−8°, 9°), and N (0°, 27°), except for N (11°, 4°) (Fig. 3). For the same krill length, the ΔTS with orientation were up to 2.8, 3.7, 5.7, 4.8, 4.3, and 5.9 dB at ΔTS70–38 kHz, ΔTS120–38 kHz, ΔTS120–70 kHz, ΔTS200–38 kHz, ΔTS200–70 kHz, and ΔTS200–120 kHz, respectively. In a study on the acoustic scattering properties of Meganyctiphanes novegica, a major krill species in the northern hemisphere, using SDWBA, the distribution of orientation had the greatest impact among the various parameters of the model (Peña & Calise, 2016). Our findings also suggest that orientation distribution substantially affects both the pattern of multi-frequency differences and TS. Thus, accurately observing krill orientation during acoustic surveys is crucial for enhancing the precision of krill acoustic identification from gathered data. However, a standardized protocol for observing krill orientation distributions is currently lacking, underlining the need for a uniform methodology to minimize errors arising from varied observation techniques.

Conclusion
In this study, we employed the SDWBA model to ascertain the ΔTS variations at multiple frequencies in Antarctic and ice krill, focusing on parameters such as density and sound speed contrasts, fatness, and orientation. The study revealed that both krill fatness and orientation play significant roles in influencing the variation of ΔTS in krill. These findings are instrumental for the acoustic identification and biomass estimation of Antarctic krill and ice krill, key biological resources in the Southern Ocean. Additionally, this research lays a foundational groundwork for future applications of broadband acoustic systems in this field.


