Introduction
Zooplankton is a crucial component of marine ecosystems as they transfer materials and energy from lower to higher trophic levels. They consume phytoplankton, thereby reducing their population, and also influence the growth and survival of fish larvae. The zooplanktons found within South Korean coastal waters consist of euphausiids, copepods, amphipods, decapods, and isopods the dominant species being euphausiids and copepods. Euphausiids (Euphausia pacifica) inhabit the seas around South Korea and are distributed widely around the northern Pacific Ocean. They play a significant role in marine ecosystems where they connect the primary producers (phytoplankton) and the top predators. Copepods constitute approximately 70% of zooplankton; they consume primary producers, transferring the energy to the next trophic level. Since their mobility is limited, their community structure and distribution patterns depend on the physical and chemical conditions of their surrounding environment (Gómez-Gutiérrez et al., 2005; Lee et al., 1999, 2021; Yoon et al., 2015).
Measuring the density and biomass of euphausiids and copepods is crucial, and both plankton nets and acoustic investigation methods are used to identify the density and biomass of zooplanktons. Plankton nets can assist in species-type differentiation and qualitative analysis. However, they may display flight responses to the nets during collection, and, depending on the survey area, the surveys can take a considerable amount of time and effort.
An acoustic survey can provide data on the take-all stratum of wide areas of sea relatively rapidly, so it is ideal for identifying the temporal and distribution and biomass of marine organisms (Cox et al., 2011; Fielding et al., 2014; Han et al., 2017; La et al., 2016; Lawson et al., 2008; Seo et al., 2016). Hydro-acoustics apply the dB difference method, which uses multi-frequency to identify fish and zooplankton species (Kang, 2012; Kang et al., 2002; McKelvey & Wilson, 2006; Miyashita et al., 1998).
This study aims to identify species and estimate densities of copepods and copepods using multiple frequencies (38, 70, 120, 200 kHz).
Materials and Methods
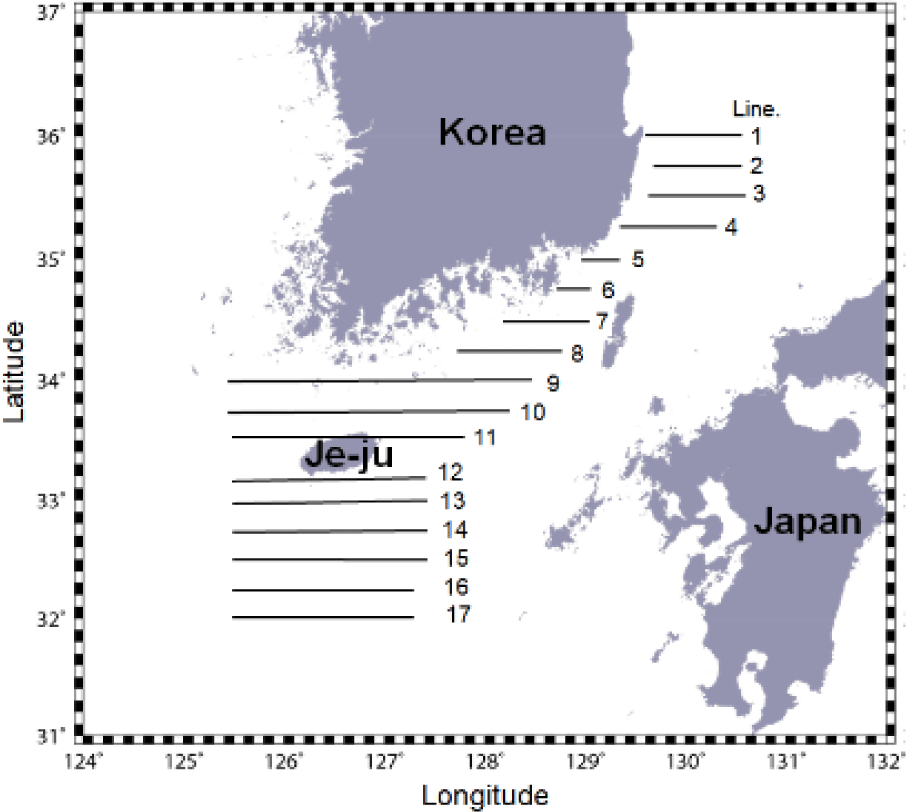
An acoustic survey, ranging from the East Sea to the southern seas surrounding Jeju Island, was conducted from the research vessel Tamgu 20th of the National Institute of Fisheries Science between June 16 and June 29, 2017 (Fig. 1). A total of 17 transects were selected in the survey area, which encompassed an area of 65,000 km2. The research vessel’s speed was maintained at 7–8 knots while collecting the acoustic data.
The acoustic system used for the survey was a split-beam type scientific echo sounder (EK60, Simrad, Norway), and acoustic data were collected at 18, 38, 70, 120, and 200 kHz. The continuous location data was obtained from the receiver and entered into the scientific echo sounder. The acoustic data saved in the computer included Differential Global Positioning System (DGPS) location data.
Later, in the laboratory, hydro-acoustic data processing software (Echoview V 8.0, Echoview Software Pty, Tasmania, Australia) was used to analyze and process the acoustic data collected during the survey. Acoustic data at 18, 38, 70, 120, and 200 kHz were collected for distinguishing the zooplankton. However, low frequencies were excluded because small organisms such as zooplankton can be detected at low frequencies, such as 18 kHz (Fig. 2).
Background noise is generated when the depth of the survey area is outside the detection range of the studied frequency and when the acoustic intensity is relatively high. Noise was eliminated in consideration of the data sample values included in the vertical and horizontal areas. When the signal-to-noise ratio (SNR) value is greater than the threshold value δ, the data sample value is eliminated after being converted to -999 dB a method known as the time-varied threshold (De Robertis & Higginbottom, 2007; Echoview, 2018). (Table 1).
Impulse noise is generated from the interference of the acoustic equipment loaded on another vessel. Its irregular and vertical shape resembles thick raindrops. Impulse noise is eliminated when the subtracted sample value of the change in the horizontal range of the selected site’s central data sample is greater than the threshold value a method known as the two-sided comparison (Kang et al., 2019) (Table 2).
To differentiate the euphausiid and copepod echoes, the properties and differences between the euphausiid and copepod frequencies at 38, 70, 120, and 200 kHz must be identified. Here, the frequency difference refers to the difference in the average mean volume backscattering strength (MVBS) of the multi-frequency. For the ∆MVBS value to be positive, the acoustic target strength (TS) of the frequency of each target species must be compared for classification, with the frequency with the smallest TS value subtracted from the frequency with the largest TS value. The ∆MVBS from the new echogram of 38, 70, 120, and 200 kHz organized into a matrix can be expressed as equation (3).
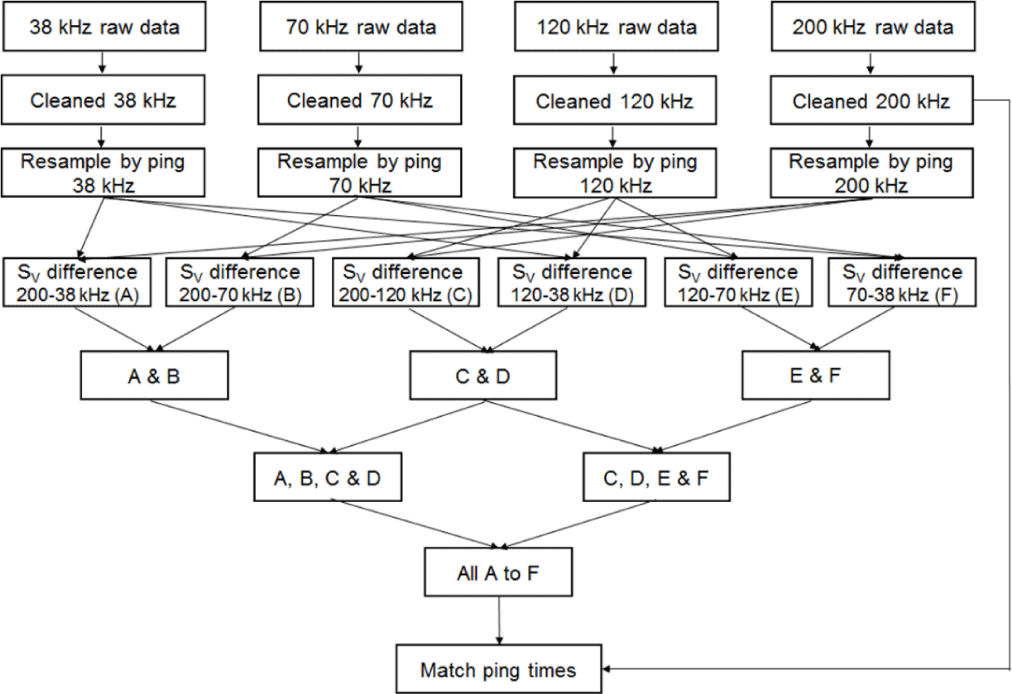
The data processing flow of differentiating euphausiid from copepod frequencies is shown in Fig. 3. When the noise (sea surface, sea bottom, etc.) is filtered before establishing the integration section, a matrix for each frequency is formed to generate a new echogram. This study applied the cell size 10 ping × 1 m (width × height) to examine the differences in frequencies.
When the dB difference between each euphausiid and copepod becomes definite, the value range is established to create a data range bitmap. For each echo and frequency established within this range, a mask with an echo that matches the cell size is made, which is further divided into the ping intervals where the echoes matching with the noise-eliminated echoes are considered euphausiid and copepod echoes. These echoes can then be distinguished using the above method.
We used the nautical area scattering coefficient (NASC) values converted from volume backscattering strength (SV) data drawn at one nautical mile from the fish finder in order to estimate the density of euphausiids and copepods using acoustics. Equation (4) shows the conversion relationship from SV to NASC.
The NASC value is the linear combination of the signals received from the aquatic organisms within a volume, so the density (ρ, g m2) of the target organism can be obtained by dividing the average NASC value by the TS of the target fish (Equation (9)). The TS and backscattering cross-section (σ) depending on the target organism’s body length (L, mm) can be expressed in equations (5), (6) and (7), respectively.
The target organism’s body length (L, mm)-weight (w, mg) relationship is shown in equation (8).
Here, the catch data that were fished with fishing gear at the same time as the acoustic survey were used for backscattering cross-section and body length-weight function equations of the target organism. Zooplankton were collected using Bongo net, which showed that euphausiids and copepods were dominant among the collection data. The minimum and maximum lengths of the euphausiids were 12 mm and 17 mm, while the minimum and maximum lengths of copepods were 1 mm and 5 mm, respectively (Table 3).
| Group | Min (mm) | Max (mm) | Avg. (mm) |
|---|---|---|---|
| Euphausiids | 12.0 | 17.0 | 14.0 |
| Copepods | 1.02 | 5.10 | 2.61 |
The target organism’s density (ρ) can be obtained by dividing the average NASC within the volume at one nautical mile distance by the backscattering cross-section (σ) and multiplying the weight (equation (9)). All except NASC on the right side of equation (8) are conversion factors that calculate the density from the acoustic data, which considers the backscattering cross-section and body length-weight of the target organism. Average values were used for the backscattering cross-section and for the weight of the target organism.
For equation (10) (krill body length-weight relationship) and equation (11) (copepod body length-weight relationship), we used the study results of Tojo et al. (2011) and Kobari et al. (2003), respectively.
where the weight is W (mg), and the body length is TL (mm).
where the weight is W (mg), and the body length is PL (mm).
Equation (12) and equation (13) were used for the TS-body length relationship equation for krill Matsukura et al. (2009b) and copepods Stanton & Chu (2000), respectively.
The average target organism density (ρ̅) of the entire investigated sea area was the weighted mean of each transect’s average density data, as shown in equation (14).
where, ρi̅: average density of the ith transect; ni EDSU of the ith transect; N: number of transects.
Results and Discussion
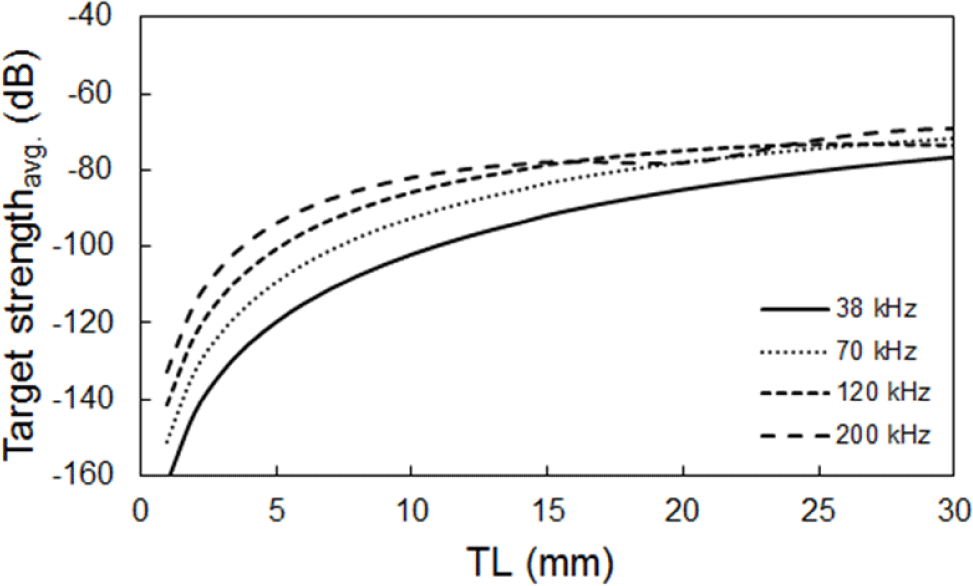
The body length-TS relationship of each euphausiid and copepod depending on their frequencies using the DWBA model (Kobari et al., 2003) are shown in Figs. 4 and 5. The TS of euphausiids increases with the body length and frequency, while the TS of copepods increases with body length.
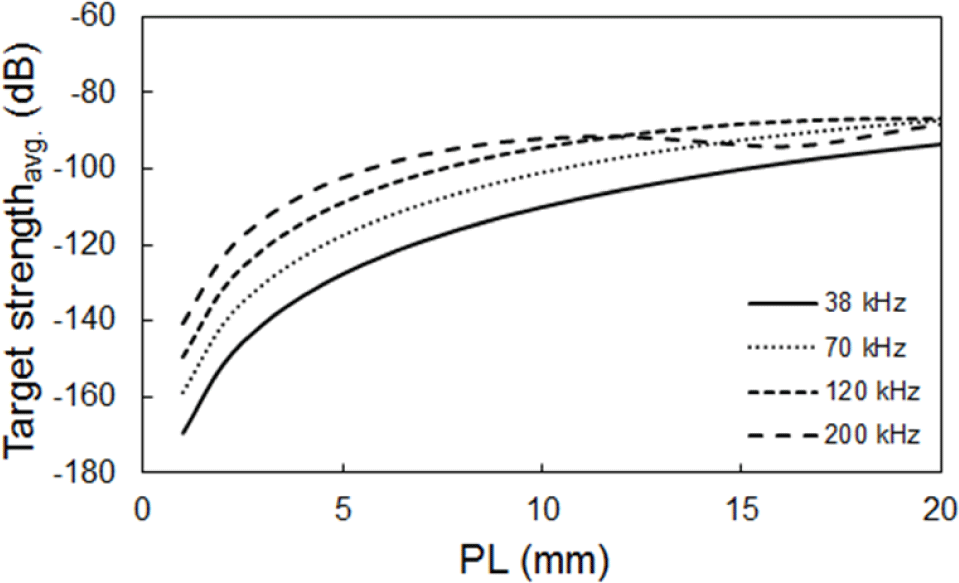
The dB differences of euphausiids and copepods, according to changes in body length, are shown in Figs. 6 and 7. For euphausiids, the dB difference, according to the change in body length, was highest at approximately 30 dB at 38–200 kHz and lowest at 5 dB at 38–70 kHz. In the frequency ranges 38–200, 70–200, and 120–200 kHz, the dB difference decreased at the 20 mm section and increased again (Fig. 6).
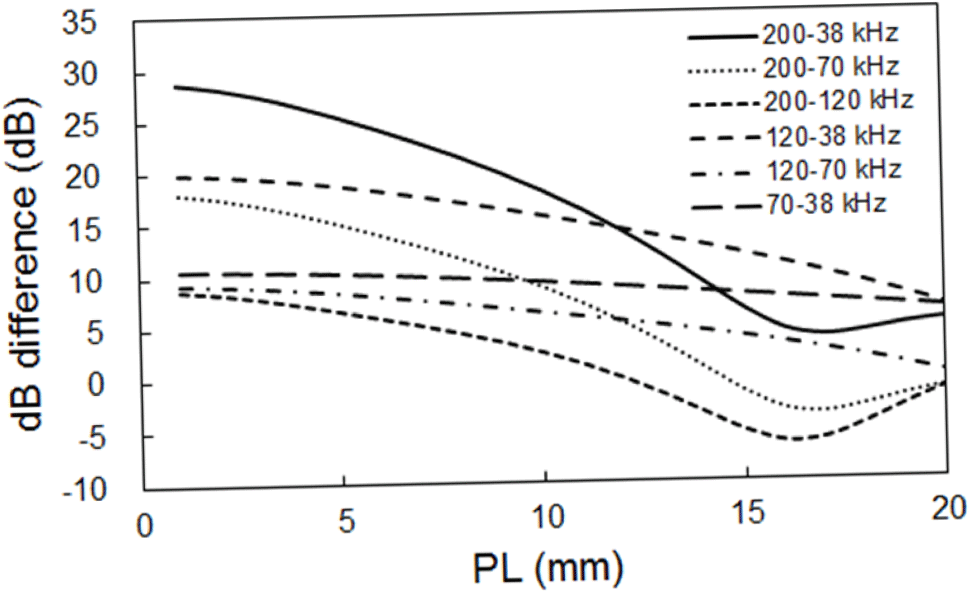
The copepod dB difference, according to changes in body length, was highest at 25 dB at 200–38 kHz and lowest at 2 dB at 70–38 kHz. In the frequency ranges 200–38, 200–70, and 200–120 kHz, they decreased at the 17 mm section before increasing again (Fig. 7). The body length range of the euphausiids collected from the investigation area was 12–17 mm and their average value was 14 mm. The copepod body length range was 1–5 mm and their average value was 3 mm. The dB differences within these size ranges are shown in Table 4. The euphausiid dB differences were 11.0–17.8, 3.3–8.8, –0.9 to 2.9, 11.9–14.9, 4.2–5.9, and 7.8–9.0 dB at 200–38, 200–70, 200–120, 120–38, 120–70, and 70–38 kHz, respectively. For copepods, they were 25.3–28.7, 15.1–18.1, 6.7–8.8, 18.7–19.9, 8.4–9.3, and 10.2–10.6 dB at 200–38, 200–70, 200–120, 120–38, 120–70, and 70–38 kHz, respectively (Table 4). The above values were applied to distinguish between euphausiids and copepods in the survey area. The previously studied dB difference of euphausiids at 120–38 kHz was greater than 10 dB (Kang et al., 2002), while the dB difference range was similar for euphausiids (11.6–15.3 dB) and copepods (13.7–17.3 dB) at 120–38 kHz (Matsukura et al., 2009b). In this frequency range, it would be difficult to distinguish between euphausiids and copepods. Kim et al. (2018) and Tojo et al. (2011) identified the dB difference between euphausiids using the 38 and 120 kHz frequencies. The euphausiid dB differences were 13.9–17.6 dB at 120–38 kHz. Kim et al. (2018) and Stanton & Chu (2000) also identified the dB difference between euphausiids and copepods using 38, 120, and 200 kHz frequencies. The euphausiid dB differences were 6–20, 6–29, and –4 to 9 dB at 120–38, 200–38, and 200–120 kHz, respectively. The copepod dB differences were 17–20, 22–29, and 5–9 dB at 120–38, 200–38, and 200–120 kHz, respectively. The dB difference values were higher in euphausiids than in copepods (Table 5).
| Species | dB differences (kHz) | Range of differences (dB) | Reference |
|---|---|---|---|
| Euphausia pacifica | 200–38 | 11.0–17.8 | This study |
| 200–70 | 3.3–8.8 | ||
| 200–120 | –0.9–2.9 | ||
| 120–38 | 11.9–14.9 | ||
| 120–70 | 4.2–5.9 | ||
| 70–38 | 7.8–9.0 | ||
| Euphausia pacifica | 120–38 | 13.9–17.6 | Kim et al. (2018) |
| 120–38 | 11.6–15.3 | Kang et al. (2002) | |
| 120–38 | 11.9–19.7 | Kang et al. (2002) | |
| 120–38 | 6.0–20.0 | Kim et al. (2018) | |
| 200–38 | 6.0–29.0 | ||
| 200–120 | –4.0–9.0 | ||
| Copepods | 200–38 | 11.0–17.8 | This study |
| 200–70 | 3.3–8.8 | ||
| 200–120 | –0.9–2.9 | ||
| 120–38 | 11.9–14.9 | ||
| 120–70 | 4.2–5.9 | ||
| 120–38 | 13.7–17.3 | Murase et al. (2009) | |
| 120–38 | 17.0–20.0 | Kim et al. (2018) | |
| 200–38 | 22.0–29.0 | ||
| 200–120 | 5.0–9.0 |
The temporal and spatial distributions of the euphausiids and copepods distinguished using dB differences are shown in (Figs. 8 and 9). The larger the NASC of euphausiids and copepods, the larger the circle size, and the closer it is to the color red.
Euphausiids in the East Sea had a larger NASC than those in the South Sea or Jeju Sea areas. NASCs were higher around the coast than in the open seas in transect 1, while the NASCs were higher in all sea areas in transect 3. NASC was nearly nonexistent in transects 5–8 in the South Sea area, while it was relatively high in transects 9, 13, and 14 in the northern and southern seas surrounding Jeju Island. The western area of transect 9 had a larger NASC than the eastern area. NASC was high in the left of transects 13 and 14. The NASC for copepods was low in all sea areas; however, it was relatively high in the East Sea compared with the other sea areas.
We compared and analyzed previous studies conducted in the southern East Sea area, where zooplankton distribution was highest. Kim et al. (2018) studied zooplankton distribution near Yeongil Bay (southern East Sea area) using a zooplankton net and acoustics from March to July, which showed that the dominant species were euphausiids. Our results also showed euphausiid distribution to be the highest in June in the same sea area.
The average densities of euphausiids and copepods in the investigated transects are shown in Figs. 10 and 11. Euphausiid density was highest at 4.4 g/m2 in transect 3 and lowest at 0.4 g/m2 in transect 13. Copepod density was also highest at 8.3 g/m2 in transect 3 and smallest at 0.8 g/m2 in transect 11. The weighted average densities and biomass of euphausiids and copepods were estimated to be 1.2 g/m2 (CV, Coefficient of Variation = 19.1%) and 2.8 g/m2 (CV = 23.5%), respectively.
Conclusions
After identifying the acoustic backscattering strength on the euphausiid and copepod analysis frequencies, the frequency difference, as ∆MVBS, from multi-frequencies can be obtained as a positive value by subtracting the frequency with the largest and smallest TS of the target species. The results of the euphausiid dB differences were 11.0–17.8, 3.3–8.8, –0.9 to 2.9, 11.9–14.9, 4.2–5.9, and 7.8–9.0 dB at 200–38, 200–70, 200–120, 120–38, 120–70 and 70–38 kHz, respectively. For copepods, they were 25.3–28.7, 15.1–18.1, 6.7–8.8, 18.7–19.9, 8.4–9.3, and 10.2–10.6 dB at 200–38, 200–70, 200–120, 120–38, 120–70 and 70–38 kHz, respectively. The acoustic scattering character of euphausiids and copepods using the DWBA model showed that the TS of euphausiids increased as body length and frequency increased. At 200 kHz, the TS decreased in correspondence of approximately a body length of 20 mm before increasing again. This was similar to 70 kHz but lower than 120 kHz. Moreover, the difference in the TS values for each frequency decreased as body length increased. The TS of copepods also increased as body length and frequency in-creased. At 200 kHz their body length decreased at approximately 15 mm before increasing again, so the TS value was lower than that at 70 or 120 kHz. Currently, South Korea is implementing a fishing quota system lefting on TAC fish species. Therefore, as in this study, a distribution survey of food organisms can form the basis for fishery resource management. In addition, there is a lack of research on species identification using more than three frequencies, so this paper can be used as a basis for research on species identification using more than three frequencies.


