Introduction
Vibrio spp. are facultative, oxidase positive (except Vibrio metschnikovii), non-spore-forming gram-negative bacteria that survive in marine environments (Bross et al., 2007; Tantillo et al., 2004; Tsai et al., 2009). Pathogenic species such as Vibrio parahaemolyticus, Vibrio vulnificus, and Vibrio cholerae are causative agents of foodborne diseases upon consumption of raw or undercooked seafood (Gauthier, 2015; Yan et al., 2019). Among the pathogenic Vibrio spp., V. parahaemolyticus has been subjected to microbial risk assessment in various foods and V. vulnificus and V. cholerae are categorized as highly pathogenic Vibrio (Baker-Austin et al., 2018; Jones & Oliver, 2009). Especially in 2020, cases of sepsis caused by V. vulnificus increased by two fold since 2019, and most infections were recorded between August and September (KCDC, 2020). This pathogen can cause death in approximately 50% of infected patients (KCDC, 2020). While V. cholerae originated abroad, domestic cases have been reported in Korea in 2016 (KCDC, 2017). V. vulnificus and V. cholerae infections may cause death in immunocompromised patients within few hours, owing to dehydration and systemic symptoms (KCDC, 2005).
The whip-arm octopus is a rich source of protein, taurine, various amino acids, iron, calcium, minerals, eicosapentaenoic acid, and docosahexaenoic acid, and its consumption decreases cholesterol levels (Lyu, 2003). Whip-arm octopus production ranks fourth among mollusks and it is the tenth most consumed seafood annually (KOSIS, 2018; KREI, 2014). In South Korea, the whip-arm octopus is occasionally consumed in the raw form. Hence, Vibrio spp. infection can be caused by whip-arm octopus consumption, owing to incomplete washing of sediment from the foreshore and storage water contaminated with Vibrio spp. V. vulnificus has been detected in whip-arm octopus (MFDS, 2003).
Therefore, this study estimated the risk of infection with highly pathogenic Vibrio spp. such as V. vulnificus and V. cholerae following whip-arm octopus consumption.
Materials and Methods
To investigate the prevalence of highly pathogenic Vibrio spp. in whip-arm octopus, 180 whip-arm octopus samples were collected from supermarkets, wet markets, and restaurants on the south shore (Tongyeong, Korea), east shore (Gangreung, Korea), west shore (Goonsan, Korea), and central area (Seoul, Korea) of Korea. The most probable number-polymerase chain reaction (MPN-PCR) method was used to detect highly pathogenic Vibrio spp., as described by Jang et al. (2018), Kim et al. (2019), and Nandi et al. (2000). The samples (25 g) were aseptically transferred to filter bags (3M, St. Paul, MN, USA) containing 225 mL of 0.85% saline buffer, and the samples were pummeled using a pummeler (BagMixer®, Interscience, St. Nom, France) for 1 min. Homogenates (0.1, 1, and 10 mL) were inoculated into five test tubes containing 10 mL of alkaline peptone water (APW; Oxoid, Basingstoke, UK) to obtain a final concentration of 1 × APW. All tubes were incubated at 35°C for 14 h. For PCR analysis, the cultures were centrifuged at 13,475×g for 2 min, and the supernatants were discarded. The cell pellets were resuspended in 0.1 mL of distilled water and centrifuged at 13,475×g for 2 min. The suspension was heated at 100°C for 10 min to extract DNA, which was used as a DNA template for PCR (Ha et al., 2020). Primers for V. vulnificus (F: CAG CCG GAC GTC GTC CAT TTT G, R: ATG AGT AAG CGT CCG ACG CGT) and V. cholerae (F: CAC CAA GAA GGT GAC TTT ATT GTG; R: GGT TTG TCG AAT TAG CTT CAC C) were used, as suggested by Kim et al. (2015) and Nair et al. (1994), respectively. DNA amplification was performed using FastMix (Intron Bio, Seongnam, Korea), including dNTP, DNA polymerase, reaction buffer, and magnesium chloride (MgCl2). The amplification of V. vulnificus and V. cholerae was performed as per the following procedures: initial denaturation at 94°C for 5 min; 25 cycles (V. vulnificus) or 30 cycles (V. cholerae) of denaturation (94°C for 30 s), elongation (60°C [V. vulnificus] or 64°C [V. cholerae] for 30 s), and extension (72°C for 30 s); and final extension at 72°C for 10 min. PCR products were electrophoresed on a 1.5% agarose gel for 20 min and visualized under UV light. The number of positive test tubes per five test tubes that were analyzed by PCR was counted for each dilution, and the MPN was determined using an MPN table (FDA, 2020). A loopful of the positive test tube from the PCR analysis was streaked on thiosulfate citrate bile salts sucrose agar (TCBS; Becton, Dickinson and Company, Sparks, MD, USA), and the plates were incubated at 35°C for 18–24 h. The typical colonies of V. vulnificus and V. cholerae on the plates were inoculated into 10 mL tryptic soy broth (TSB, Becton, Dickinson and Company; non-selective broth) containing 3% sodium chloride (NaCl) to isolate a single colony and incubated at 35°C for 18–24 h. Non-selective broth was used for the isolation of Vibrio spp. to improve recovery of damaged cells or decrease stress on Vibrio spp. The DNA extraction method, primers, and PCR conditions used were the same as those described above. The sample showing positive results in both MPN-PCR and TCBS agar was determined as positive. In addition, temperature and time during transfer and storage were collected by interviewing people who work in supermarkets, wet markets, and restaurants.
In a previous study, the growth of V. vulnificus and V. cholerae was not different; thus, predictive models applicable to both species have been developed. Briefly, 100 μL aliquots of V. vulnificus strains ATCC27562, NCCP14549, and NCCP11887, and V. cholerae strains NCCP14552 (non-O1) and NCCP12842 (O23) in cryovials stored at −80°C were inoculated into 10 mL of Luria-Bertani (LB) broth (Becton, Dickinson and Company) with 2% NaCl and incubated at 37°C for 28 h. The cultures (0.1 mL) were then inoculated into 10 mL of LB broth plus 2% NaCl and incubated at 37°C for 12 h. The subcultures of V. vulnificus and V. cholerae strains were mixed and then centrifuged at 1,912×g and 4°C for 15 min. The cell pellet was washed twice with phosphate-buffered saline (PBS; 0.2 g potassium chloride [KCl], 0.2 g monopotassium phosphate [KH2PO4], 8.0 g NaCl, and 1.5 g disodium hydrogen phosphate [Na2HPO4 · 7H2O] in 1 L distilled water pH 7.4) and resuspended in 50 mL of APW to obtain the inoculum at 6 Log CFU/mL.
If sea water is infected with V. vulnificus and V. cholerae, the pathogens can contaminate the surface and accumulate in the intestine of the octopus during breathing. Thus, a mixture of 1,750 g sun-dried salt and 1,750 g artificial sea salt (Reef Salt Mix, KENT Marine, Franklin, WI, USA) was dissolved in 100 mL tap water to prepare artificial seawater. To simulate the infection of the whip-arm octopus with highly pathogenic Vibrio spp. in contaminated seawater, the inoculum was inoculated into seawater at 4.0 Log CFU/mL in water tanks, and the live whip-arm octopus was placed into the water tanks. Water tanks were provided with an oxygen supply device and were stored at 7°C, 10°C, 15°C, and 20°C for up to 6 days, depending on the storage temperature.
After removing the head, the whip-arm octopus was placed in the sample bag (3M) with twice the amount of APW. The sample was pummeled in a pummeler for 1 min. Homogenates were diluted with APW, and the diluents were spread-plated on CHROMTM agar Vibrio (CHROMagar, Paris, France). The plates were incubated at 37°C for 24 h. Typical colonies (turquoise blue) of V. vulnificus and V. cholerae were manually counted.
To develop a primary model, cell counts of highly pathogenic Vibrio spp. were fitted with the Baranyi model (Baranyi & Roberts, 1994; Ha et al., 2020) using the DMfit software to calculate the maximum specific growth rate (μmax; Log CFU/g/h) and lag phase duration (LPD; h) at each storage temperature. The Baranyi model is as follows:
The kinetic parameters were fitted into a secondary polynomial model as a function of storage temperature as follows:
The performance of the developed models was evaluated by comparing the derived predicted values and objective values collected at 13°C and 17°C. The differences between the predicted and observed values were indicated by the root mean square error (RMSE), bias factor (Bf), and accuracy factor (Af) (Ross, 1996) as follows:
The time and temperature data for transportation and storage of the whip-arm octopus were collected via personal communication with people who were in the business. Using these data, the appropriate probability distribution for time and temperature at each step was determined using the @RISK program (Version 7.6, Palisade, Ithaca, NY, USA).
Data on the daily consumption amount and frequency of whip-arm octopuses in South Korea were obtained from the Korea National Health and Nutrition Examination Survey (2017) (KCDC, 2019). Using these data, the appropriate probability distribution for the daily consumption amount was determined using the @RISK program.
To evaluate the doses (CFU) of V. vulnificus and V. cholerae that cause foodborne illness, the most appropriate dose-response models were searched and selected in the literature.
A simulation model was prepared in the @RISK program with data of highly pathogenic Vibrio spp. prevalence and initial concentration, the predictive models applied to distribution time and temperature, consumption amount and frequency, and dose-response models. The risk of foodborne illnesses from highly pathogenic Vibrio spp. upon raw whip-arm octopus consumption was estimated using a simulation model with 10,000 iterations.
Kinetic parameters (LPD and μmax) from the predictive (primary) models were analyzed using a general linear model (GLM) procedure in SAS® (Version 9.3, SAS Institute, Cary, NC, USA). The mean comparison of the kinetic parameters among storage temperatures was conducted using a pairwise t-test at α = 0.05.
Results and Discussion
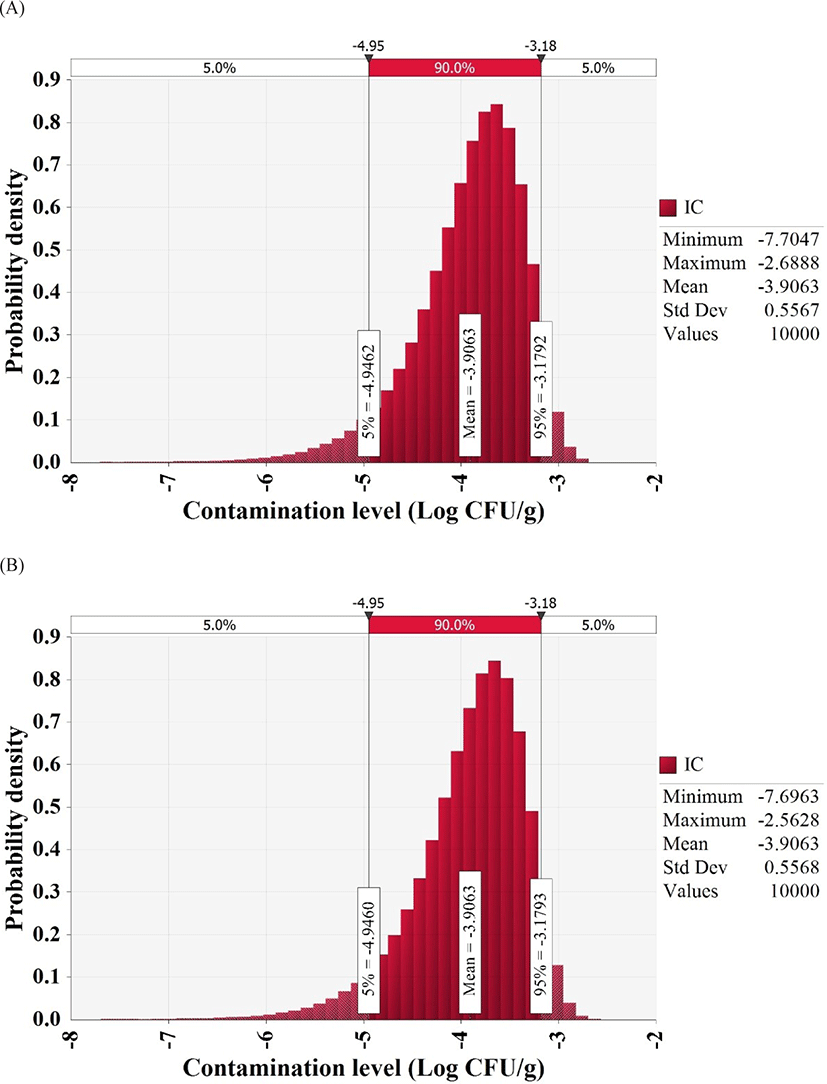
To detect pathogens, we collected and examined 180 whip-arm octopus samples from supermarkets, wet markets, and restaurants of four sections, including the south shore, east shore, west shore, and central area. MPN-PCR analysis showed that V. vulnificus count was below the detection limit (30 MPN/100 g) and V. cholerae count was 36 MPN/100 g in one sample from the east shore, one sample from the west shore, and three samples from the central area. However, the cultures from contaminated samples were streaked on TCBS plates and the colonies obtained on the plates were subjected to PCR analysis, which deemed all samples negative for V. vulnificus and V. cholerae. Thus, all whip-arm octopus samples were negative for the highly pathogenic Vibrio spp., and the beta distribution fitting, as suggested by Vose (1996), estimated an initial contamination level of −3.9 Log CFU/g (Fig. 1).
Times for transport and display of whip-arm octopus were between 0 and 72 h, and the mode was 4 h. These values were fitted with the Pert distribution, and the result was as follows: Pert [0, 4, 72]. The collected temperatures were fitted with the minimum extreme value distribution, and the result was expressed as ExtValueMin [15.1959, 2.4783].
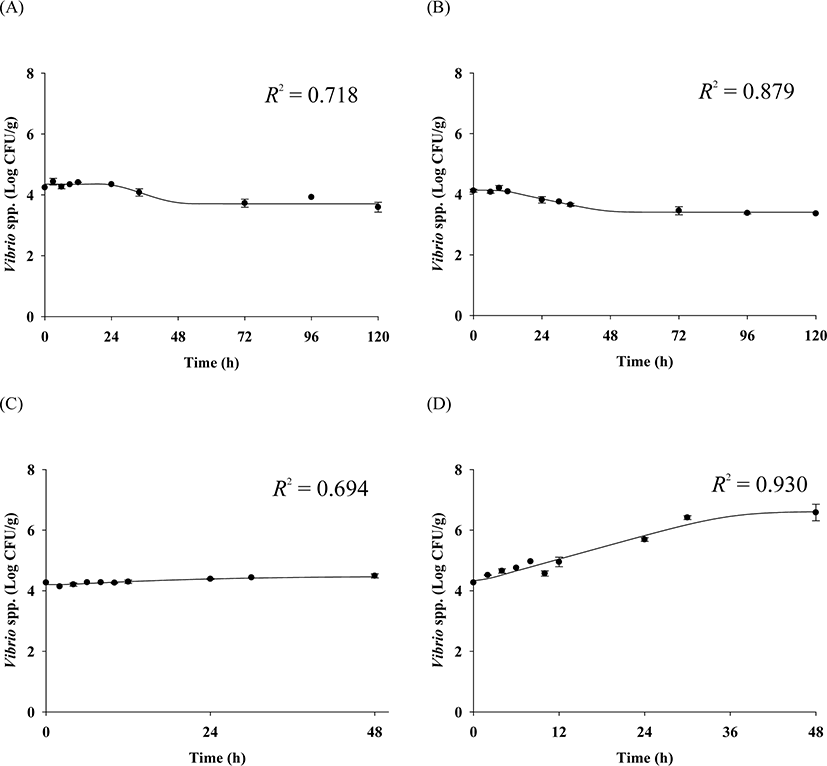
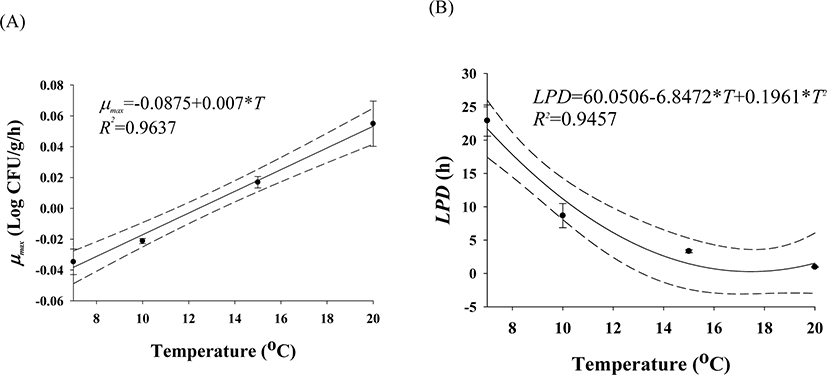
The cell counts of highly pathogenic Vibrio spp. in live whip-arm octopus gradually decreased at 7°C and 10°C but increased at 15°C and 20°C (Fig. 2). FAO & WHO (2020) also suggested that V. vulnificus failed to grow below 10°C but could grow gradually above 15°C. According to the previous study by Kaspar & Tamplin (1993), the pathogenic Vibrio spp. can grow better as the temperature increases, and not survive well at temperatures below 8.5°C, which is similar to these results. The results of our study show that Vibrio spp. can grow in live seafood during storage at temperatures above 15°C. The fitting results from the Baranyi model with the cell counts produced kinetic parameters such as LPD and μmax, as shown in Table 1. Since the Baranyi model provides biological interpretation for the duration of the lag phase, and both growth and death rates, the model was used for primary modeling. The R2 values were 0.694–0.930. The LPD decreased but increased as the temperature increased (Table 1). The LPD and μmax values were fitted with a polynomial model as a function of temperature, and the secondary models are presented in Table 2. The R2 values of the secondary models were 0.946 and 0.964 for LPD and μmax, respectively (Table 2). Thus, the developed secondary models were appropriate to describe the effect of temperature on the kinetic parameters (Fig. 3). The validation results showed that RMSEs were 0.307 and 0.263 at 13°C and 17°C, respectively. As RMSE approaches 0, the prediction of the secondary predictive model is accurate. Furthermore, Bf values were 1.02 and 0.96 at 13°C and 17°C, respectively, indicating that the predictive models over-predict by 2% at 13°C and under-predict by 4% at 17°C. Af values were 1.06 and 1.05 at 13°C and 17°C, respectively. As Af value approaches 1, the prediction of the predictive model is accurate. Although R2 values were not very high in the primary models, the validation results indicate that the developed predictive models were appropriate to describe cell count changes of highly pathogenic Vibrio spp. under the temperature and time during transport and display of live whip-arm octopus.
| Parameter | Equation | R2 |
|---|---|---|
| μmax | μmax = −0.0875 + 0.007 × T | 0.964 |
| LPD | LPD = 60.0506 − 6.8472 × T + 0.1961 × T2 | 0.946 |
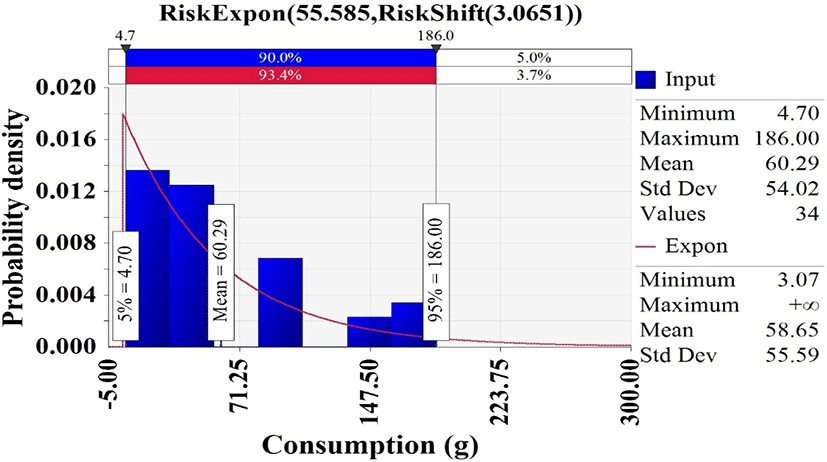
In Korea National Health and Nutrition Examination Survey (KCDC, 2019), 34 of 7,167 respondents had consumed whip-arm octopus, and the consumption frequency was 0.47% [(34/7,167) × 100]. Hence, the discrete distribution was used to describe the probability of consuming a whip-arm octopus. The consumption amounts from the respondents with whip-arm octopus were fitted with @RISK. The appropriate probability distribution was the exponential distribution (Expon [55.585, Shift [3.0651]) that showed an average consumption of 58.65 g (Fig. 4).
To estimate the dose responses of V. vulnificus and V. cholerae, the commonly used Beta-Poisson model (probability = 1 – [1 + dose / β]−α) was selected. For V. vulnificus, the parameters were α = 9.3 × 10⁻⁶ and β = 1.1 × 10⁵ (WHO & FAO, 2005a). For V. cholerae, the parameters were α = 1.31 × 10⁻¹ and β = 1.49 × 10⁷ (Cash et al., 1974; WHO & FAO, 2005b).
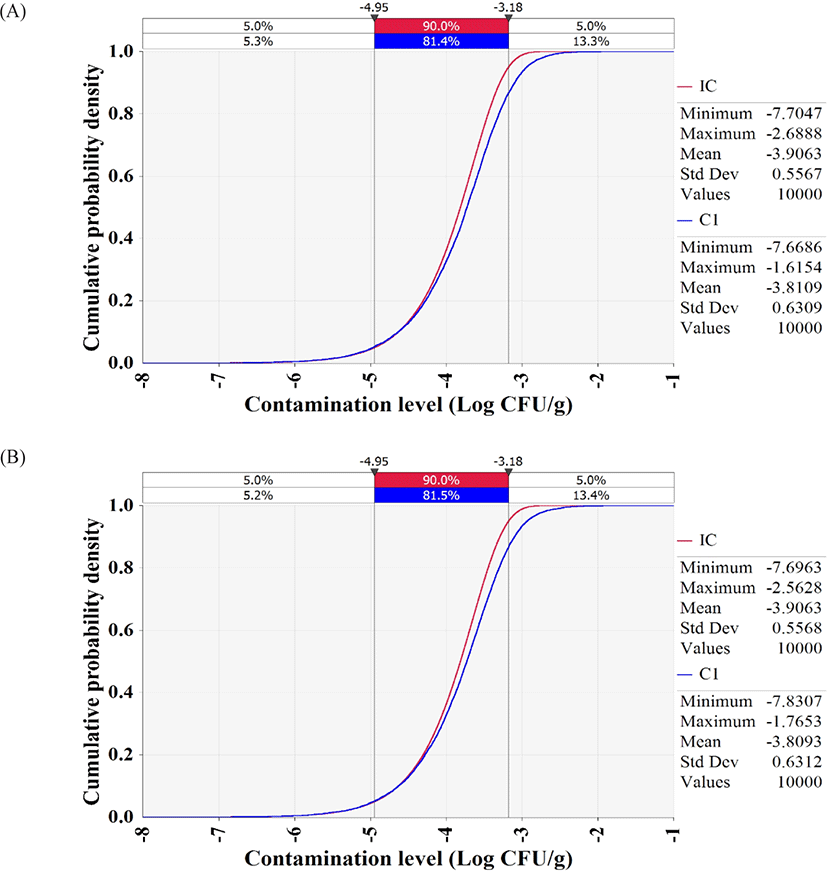
The simulation models were formulated with the estimated levels of initial contamination, predictive models, probability distributions for temperature and time, probability distribution of consumption amounts, consumption frequency, and dose response models, as presented in Table 3. The simulation showed that the contamination levels of V. vulnificus and V. cholerae in whip-arm octopus samples were −3.8 Log CFU/g after transport and display (Fig. 5), indicating only 0.1 Log CFU/g increase from the initial contamination level (−3.9 Log CFU/g). Thus, the highly pathogenic Vibrio spp. do not grow in live whip-arm octopus at the investigated temperature and time. Live whip-arm octopus was transported and displayed at 0°C–10°C and sold within 4 days. Therefore, the pathogen could not grow. In addition, the simulation showed that the probabilities of foodborne illness per person per day were 8.71 × 10⁻¹⁵ for V. vulnificus and 7.08 × 10⁻¹³ for V. cholerae.
| Input model | Unit | Variable | Formula | Reference |
|---|---|---|---|---|
| DISTRIBUTION | ||||
| Product | ||||
| Pathogens contamination level | ||||
| V. vulnificus prevalence | PR | = RiskBeta (1,181) | This research; Vose (1996) | |
| V. cholerae prevalence | PR | = RiskBeta (1,181) | ||
| Initial contamination level | CFU/g | C | = −ln (1 − PR) / 25 | Sanaa et al. (2004) |
| Log CFU/g | IC | = Log(C) | ||
| MARKET | ||||
| Market display | ||||
| Display time | h | Timemark-dis | = RiskPert (0,4,72) | This research; Personal communication1) |
| Display temperature | °C | Tempmark-dis | = RiskExtValueMin (15.1959, 2.4783, RiskTruncate (0,18.8)) | This research; Personal communication |
| Growth/death | ||||
| Log CFU/g | h0 | = Average (µmax × LPD), Fixed 0.02767 | This research; Baranyi & Roberts (1994) | |
| Log CFU/g | Y0 | = Average (Y0i), Fixed 4.3 | This research; Baranyi & Roberts (1994) | |
| Log CFU/g | Yend | = Average (Yendi), Fixed 4.6 | This research; Baranyi & Roberts (1994) | |
| ln(q) | = ln (1 / (EXP(h0) − 1)) | This research; Baranyi & Roberts (1994) | ||
| µmax | Log CFU/g/h | GRmark-dis | = −0.0875 + 0.007 × Tempmark-dis | This research; Baranyi & Roberts (1994) |
| Pathogenic Vibrio growth/death model | Log CFU/g | C1 | = IC + 1 / (1 + EXP(−ln(q))) × (1 − 10–|Y0–Yend| / ln(10)) × GRmark-dis × Timemark-dis | This research; Baranyi & Roberts (1994) |
| CONSUMPTION | ||||
| Daily consumption frequency | % | ConFre | Fixed 0.47 | KCDC (2019) |
| CF(0) | = 1 − 0.47/100 | KCDC (2019) | ||
| CF(1) | = 0.47/100 | KCDC (2019) | ||
| CF | = RiskDiscrete ({0,1}, {CF(0), CF(1)}) | KCDC (2019) | ||
| Daily consumption amount | g | Consump | = RiskExpon (55.585, RiskShift (3.0651), RiskTruncate (4,190)) | KCDC (2019) |
| Final consumption amount | g | Amount | = IF(CF = 0, 0, Consump) | |
| DOSE-RESPONSE | ||||
| V. vulnificus amount | CFU | D | =10C1 × Amount | |
| α | Fixed 9.3 × 10⁻⁶ | WHO & FAO (2005a) | ||
| β | Fixed 1.1 × 10⁵ | WHO & FAO (2005a) | ||
| V. cholerae amount | CFU | D | =10C1 × Amount | |
| α | Fixed 1.31 × 10⁻¹ | Cash et al. (1974); WHO & FAO (2005b) | ||
| β | Fixed 1.49 × 10⁷ | Cash et al. (1974); WHO & FAO (2005b) | ||
| RISK | ||||
| Probability of illness/person/day | Risk | = 1 − (1 + D/β)−α | Cash et al. (1974); WHO & FAO (2005a, 2005b) | |
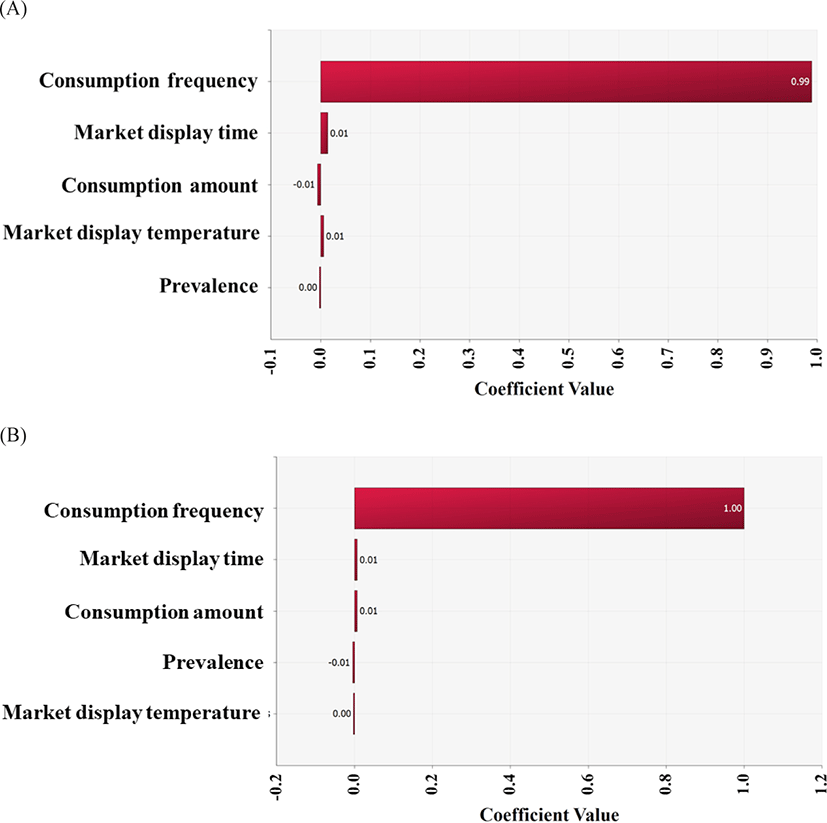
In conclusion, the risk of infection by the highly pathogenic Vibrio spp. via raw whip-arm octopus consumption is low. This might be related to the low contamination level and low growth of pathogens under the conditions of temperature and time. In addition, a very low consumption frequency (0.47%) affected the risk, as indicated by the correlation coefficient (Fig. 6).
