Background
Protease inhibitors commonly accumulate in high quantities in plant and animal tissues (Sangorrin et al. 2001), plant seeds, bird eggs, and various body fluids. Protease inhibitors are also found in poultry (Lopuska et al. 1999), blood plasma (Rawdkuen et al. 2005; Rawdkuen et al. 2007), fish roe (Kim et al. 2013a,b; Choi et al. 2002; Klomklao et al. 2014), and viscera (Kishimura et al. 2001).
These inhibitors play a significant role in the regulation of proteolysis, whether the target enzymes are of exogenous or endogenous origin. Protease inhibitors permit the regulation of the rate of proteolysis in the presence of the active enzyme (Barret 1986; Knight 1986; Cherqui et al. 2001). The presence of protease inhibitors has been demonstrated in the blood and muscle of rainbow trout (Clereszko et al. 2000), chum salmon (Yamashita and Konagaya 1991), white croaker (Sangorrin et al. 2001), hake skeletal (Martone et al. 1991), and the roe of Alaska pollock, bastard halibut, skipjack tuna, yellowfin tuna (Kim et al. 2015; Ji et al. 2011), herring (Oda et al. 1998), and carp (Tsai et al. 1996).
In industries of surimi-based product, commercial protease inhibitors are used to prevent the modori (gel softening) phenomenon and to maximize the gel strength of surimi. The most commonly used inhibitors are bovine plasma protein (BPP), chicken egg white, potato powder, and whey protein concentrate (Hamann et al. 1990; Weerasinghe et al. 1996; Kim et al. 2015). However, the use of BPP has been prohibited, due to the occurrence of mad cow disease. Egg white is expensive and has an undesirable egg-like odor, while off-color problems may be encountered when potato powder is used (Akazawa et al. 1993). Therefore, alternative food-grade proteinase inhibitors from marine resources for surimi production are still needed.
Fish roe, a byproduct generated from fish processing (3.0–30.0 % depend on fish species), is a highly nutritious material rich in essential fatty acids and amino acids (Narsing Rao et al. 2012). Protease inhibitors in fish roe can have a major impact on nutritional value as they inhibit pancreatic serine proteases, thus impairing protein digestion. However, fish roe can be used as a potential source of proteinase inhibitor and can be for a variety of applications such as medicine, agriculture, and food technology (Klomklao et al. 2014).
Protein fractionation methods may be divided into those based on differential solubility, differential interaction with solid media, and differential interaction with physical parameters (Rawdkuen et al. 2005). In our previous study (Kim et al. 2013a), the protease inhibitor was fractionated from fish eggs using methods based on protein solubility using organic solvent and ammonium sulfate (AS). AS fractionation in isolating the protease inhibitor was more effective than organic solvent precipitation (Kim et al. 2013a). However, AS fractionation methods have the disadvantage of either requiring a high concentration or cooling to avoid denaturation (Rawdkuen et al. 2007). In the case of organic solvent fractionation, the component obtained by fractionation has a notable capacity for use, as a result of the denaturation of the protein during the process (Kim et al. 2014; Rawdkuen et al. 2007).
In order to avoid the disadvantages of these techniques, polyethylene glycol (PEG) is an alternative precipitating agent for protein fractionation. Chicken plasma was fractionated into the protease inhibitor by PEG precipitation (Rawdkuen et al. 2005; Rawdkuen et al. 2007). PEG has several advantages over other precipitants, including the least denaturation of proteins at ambient temperatures, negligible temperature control required in the range 4–30 °C, relatively small amount of precipitant required compared with AS or organic solvents, and low residual PEG concentration in the precipitate since most of the PEG is retained in the supernatant (Sharma and Kalonia 2004).
The objectives of this study were to find the best conditions for the polyethylene glycol fractionation of protein inhibitor and characterize the roe protease inhibitor from Alaska pollock and bastard halibut as white-fleshed fish and skipjack tuna and yellowfin tuna as dark-fleshed fish roes.
Methods
Alaska pollock (AP, Theragra chalcogramma) roe was obtained from Blue Ocean Co. (Busan, Korea). Bastard halibut (BH, Paralichthys olivaceus) was purchased from the fish market (Tongyoung, Korea) and immediately brought to the laboratory. Roe was separated from BH and stored at −70 °C in sealed polyethylene bags. Skipjack tuna (ST, Katsuwonus pelamis) and yellowfin tuna (YT, Thunnus albacares) roes were obtained from Dongwon F&B Co., Ltd. (Changwon, Gyungnam, Korea).
Fish roes were stored at −70 °C in sealed polyethylene bags until needed for inhibitor extraction.
Polyethylene glycol-4000 (PEG4000), which is a chemical used for fractionation, was obtained from the Yakuri Pure Chemicals Co., Ltd. (Kyoto, Japan). Trypsin, chymotrypsin, bromelain, and papain were from Sigma-Aldrich Chemical Co. (St. Louis, MO, USA). Alcalase 2.5 type DX, Neutrase 0.8 L, Flavourzyme 500 MG, and Protamex were purchased from Novozymes (Bagsvaerd, Denmark). Aroase AP-10 and Pancidase NP-2 were from Yakult Pharmaceutical Co., Ltd. (Tokyo, Japan). Protease-NP was purchased from Amorepacific Co., Ltd. (Seoul, Korea). Casein and Nα-benzoyl-DL-arginine-2-naphthylamide hydrochloride (BANA) as substrates were purchased from Sigma-Aldrich Chemical Co. (St. Louis, MO, USA). The buffer solutions (0.1 M sodium phosphate buffer, pH 6.0; 0.1 M Tris-HCl buffer, pH 9.0) for enzyme reaction were prepared according to the method of Dawson et al. (1986). Sodium dodecyl sulfate (SDS) and glycine were purchased from Bio Basic Inc. (Ontario, Canada). Coomassie brilliant blue R-250 was purchased from Bio-Rad Laboratories, Inc. (Hercules, CA, USA). Glycerol and β-mercaptoethanol were purchased from Sigma-Aldrich Chemical Co. (St. Louis, MO, USA). Bromophenol blue was purchased from Junsei Chemical Co., Ltd. (Tokyo, Japan).
All chemicals used were analytical grade.
Crude extracts (CEs) were prepared according to the modified method of Kim et al. (2013a). For extraction of CE from fish roes, the frozen roes were partially thawed and homogenized with 3 volumes (w/v) of deionized distilled water. The homogenates were incubated at 20 °C for 6 h, stirring every 1 h, and then centrifuged at 12,000×g for 20 min at 4 °C. The supernatant was used as “crude extracts” for further study.
Four CEs from fish roes were continuously fractionated using PEG4000 in the range of 0–5 % (PEG1), 5–10 % (PEG2), 10–20 % (PEG3), and 20–40 % (w/v, PEG4), and these fractions were collected by centrifugation (15,000×g, for 30 min at 4 °C) and dissolved in a minimum quantity of cold deionized water. The fractions were stored at −25 °C until further analysis.
The protein concentration of CE and PEG fractions from fish roes was determined according to the method of Lowry et al. (1951) by bovine serum albumin as a standard protein.
Enzyme activities against 0.1 % (w/v) chymotrypsin (CH) and trypsin (TR) as serine protease; 0.1 % (w/v) papain-EDTA (PED) and bromelain (BM) as cysteine protein; and 1 % (v/v) Alcalase (AL) and Neutrase (NE) and 1 % (w/v) Protease-NP (PN), Pancidase NP-2 (NP), Protamex (PR), Aroase AP-10 (AP-10), and Flavourzyme (FL) as commercial food-grade protease were measured using casein as a substrate according to the methods of Ji et al. (2011).
The CE and PEG fractions were examined for inhibitory activity against commercial proteases as mentioned above. Protease inhibitory activity was measured using casein and BANA as substrates.
When casein was used as a substrate, 50 μL of the inhibitor solution (CE and PEG fractions) was mixed with enzymes (10–100 μL) in 1.5 mL of 0.1 M sodium phosphate buffer (pH 6.0) or 0.1 M Tris-HCl buffer (pH 9.0). After incubation for 10 min at room temperature, 0.5 mL of 2 % casein was added and mixed thoroughly. The mixture was incubated for 1 h at 40 °C. The enzymatic reaction was terminated by adding 2 mL of 5 % TCA and then centrifuged at 1910×g for 15 min at 4 °C. The liberated soluble peptides in the supernatant were estimated by measuring the absorbance at 280 nm to determine the residual protease activity.
Protease activities against 0.1 % TR and 0.1 % PED were measured using BANA as the substrate according to the methods of Rawdkuen et al. (2007) with a slight modification. The 0.1 % TR (50 μL) and 0.1 % PED (100 μL) were added to 50 μg of inhibitor solution in 1.5 mL of 0.1 M Tris-HCl buffer (pH 9.0) and 0.1 M sodium phosphate buffer (pH 6.0), respectively. The mixture was incubated for 10 min at room temperature. Then, 50 μL of 10 mM BANA was added and vortexed immediately to start the enzyme reaction. After incubating for 1 h at 40 °C, 0.5 mL of 2 % HCl/ethanol was added to terminate the reaction. The reaction mixture was centrifuged at 1910×g for 15 min. The residual activity of enzymes was measured by the absorbance at 540 nm (U-2900, UV-VIS spectrophotometer, Hitachi, Tokyo, Japan).
One unit of enzyme activity was defined as an increase of 0.1 absorbance per 1 h.
One unit of inhibitory activity was defined as the amount of an inhibitor that reduced 1 unit/mg of target protease activity for 1 h.
Relative inhibitory activity (RIA) was calculated as follows:
C = enzyme activity of control (without inhibitor), A = enzyme activity of sample (with inhibitor)
Sodium dodecyl sulfate-polyacrylamide gel electrophoresis (SDS-PAGE) was carried out for the determination of the purity and molecular weight of the samples, as described by Laemmli (1970), using a 10 % Mini-PROTEAN® TGX™ Precast gel (Bio-Rad Laboratories, Inc., Hercules, CA, USA). Samples were prepared by mixing the CE and PEG fractions at a 4:1 (v/v) ratio with the SDS-PAGE sample treatment buffer (62.5 mM Tris-HCl (pH 6.8), 2 % SDS (w/v, pH 8.3), 10 % glycerol, 2 % β-mercaptoethanol, and 0.002 % bromophenol blue). The samples were heated in a boiling water bath at 100 °C for 5 min and loaded (20 μg protein) on the SDS-polyacrylamide gel, and electrophoresis was performed at constant amperage (10 mA/gel) using a Mini-PROTEAN® Tetra cell (Bio-Rad Laboratories Inc., Hercules, CA, USA). After electrophoresis, the gel was stained in a staining solution containing Coomassie brilliant blue R-250. De-staining was carried out using a solution containing acetic acid, methanol, and water (1:2:7, v/v/v). The molecular weight of samples was estimated using Precision Plus Protein™ standards (10–250 K) from Bio-Rad Laboratories, Inc., (Hercules, CA, USA). Native PAGE was performed according to the procedure of Kim et al. (2015), except that the sample was not heated and the SDS and reducing agent were left out.
Casein zymography was performed on native PAGE. Briefly, after electrophoresis, the gel was flooded with 3 mL of 0.1 % chymotrypsin. The gel was incubated for 60 min at 40 °C to allow the protease to diffuse into the gel and then washed with distilled water. The gel was immersed in 0.1 M Tris-HCl buffer, (pH 9.0) with 2 % casein (v/v) for 2 h. The gel was then rinsed with distilled water, fixed, and stained with Coomassie brilliant blue R-250 to develop inhibitory zones detected as a dark band on a clear background.
All experiments were conducted in triplicates. The average and standard deviations were calculated. Data were analyzed using the analysis of variance (ANOVA) procedure by means of the statistical software SPSS 12.0 KO (SPSS Inc., Chicago, IL, USA). The mean comparison was made using Duncan’s multiple range test (P < 0.05).
Results and discussion
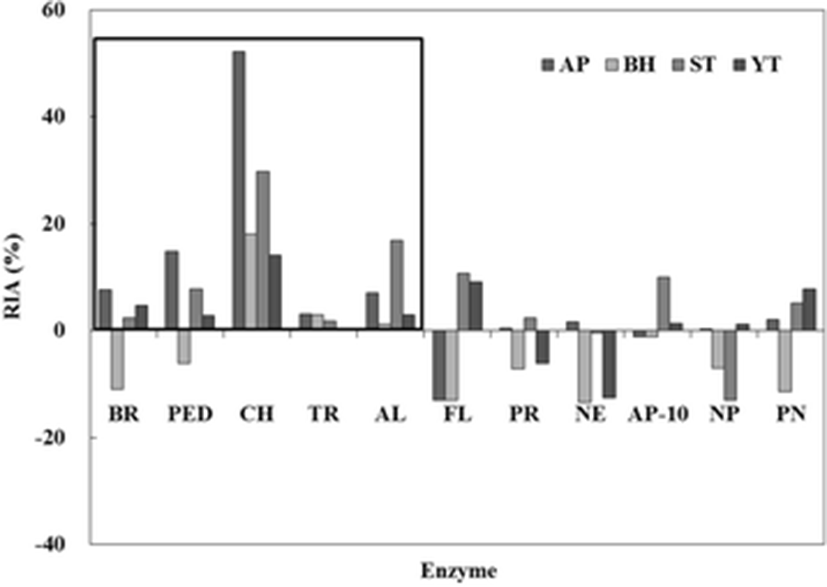
Commercial protease inhibitory activities of the crude extract (CE) from fish roes (AP, BH, ST, and YT) are shown in Fig. 1. Inhibitory activities against 11 commercial proteases were measured using casein as a substrate. The highest relative inhibitory activity (RIA, %) was found in all CEs for CH as a serine protease. Of the CEs, AP showed the highest RIA (52.2 %), followed by ST (29.7 %), BH (18.1 %), and YT (14.0 %). RIAs (0.1–3.1 %) for TR as a serine protease were lower than those of CH. RIAs of BR and PED as a cysteine protease were observed for AP, ST, and YT except for BH. Among the commercial food-grade proteases, RIAs in all CEs were observed for AL. The other proteases, such as FL, PR, NE, AP-10, and PN, showed no effect on the inhibitory activity. Therefore, these results suggested that the CE from fish roes belongs to the serine protease inhibitor family and is also more sensitive to reaction with chymotrypsin than trypsin.
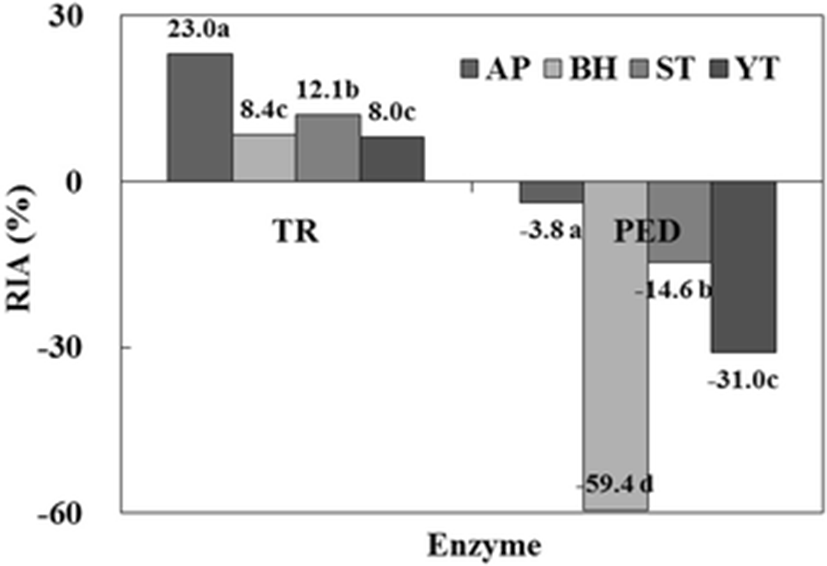
The protease inhibitory activities for trypsin (TR) and papain-EDTA (PED) of the CE from fish roes are shown in Fig. 2. Inhibitory activities were measured using BANA as a specific substrate for trypsin and papain. RIA for trypsin was the highest in AP (23.0 %), followed by ST (12.1 %), BH (8.4 %), and YT (8.0 %). Whereas, when PED as a cysteine protease was used, the CEs of all fish roes showed no effect on the inhibitory activity. Therefore, these results confirmed that the CE from fish roes belongs to the serine protease inhibitor family.
Ji et al. (2011) confirmed the distribution of protease inhibitory activity in CEs from fish roes. ST (Choi et al. 2002) and YT (Klomklao et al. 2014) were reported to possess high trypsin inhibitory activity. The protease inhibitor from chum salmon egg (Kim et al. 2006), AP egg (Ustadi et al. 2005a), and glassfish egg (Ustadi et al. 2005b) inhibited the cysteine proteases such as papain and cathepsin L, but not trypsin, a serine protease.
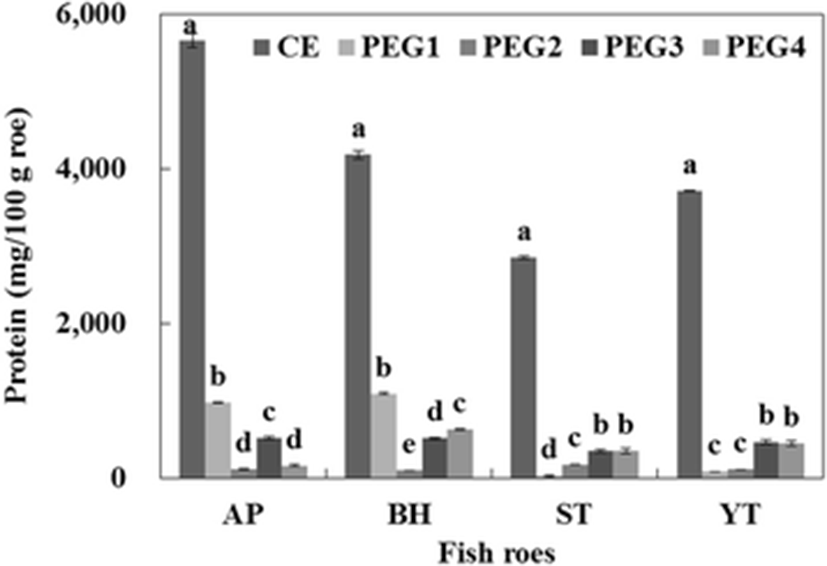
The protein contents of CE and PEG fractions from fish roes are shown in Fig. 3. The protein contents of the CE of AP, BH, ST, and YT were 5655.0, 4183.0, 2849.6, and 3711.0 mg/100 g roe, respectively. The highest protein content of PEG fraction by PEG precipitation was found in PEG1 (0–5 % fraction) for AP and BH. The protein recovered in the PEG1 fraction of AP and BH represented 55.1 and 46.8 % of the total protein content of PEG fractions, respectively. Among the PEG fractions obtained from the CE of ST, the PEG4 fraction had the highest protein content (350.8 mg/100 g roe), which constituted approximately 38.8 % of the total protein content of PEG fractions, followed by PEG4 (349.4 mg/100 g roe), PEG2 (177.5 mg/100 g roe), and PEG1 fraction (26.3 mg/100 g roe). The protein content recovered from the PEG3 and PEG4 fractions of YT represented 42.3 and 40.5 % of the total protein content of PEC fractions. From the result, greater protein in the PEG fraction suggested that a higher amount of protease inhibitors was precipitated. Bovine blood plasma (Lee et al. 1987) and chicken plasma (Rawdkuen et al. 2005; Rawdkuen et al. 2007) were fractionated into proteins and protease inhibitor by PEG precipitation with high separation efficiencies.
Commercial protease inhibitory activity and the recovery of the CE and PEG fractions from fish roes are shown in Table 1. Inhibitory activities against 1 % AL, 0.1 % BR, 0.1 % PED, 0.1 % CH, and 0.1 % TR were measured using casein as a substrate.
Minus (−) values are no protease inhibitory activity
Recovery (%) = (total inhibitory activity of fraction/total inhibitory activity of CE) × 100
PEG1–PEG4, 0–5, 5–10, 10–20, 20–40 % fractions obtained from polyethylene glycol-4000 precipitation
AL alcalase, BM bromelain, PED papain-EDTA, CH chymotrypsin, TR Trypsin, CE crude extract, SIA specific inhibitory activity, RIA (%) relative inhibitor activity
All PEG fractions obtained from CE of AP and BH showed no effect on the specific inhibitory activity (SIA) for AL as a commercial food-grade protease. The SIA of 210.3 and 209.3 U/mg with recovery of 0.2 and 3.2 % were obtained for the PEG1 fraction of ST and YT, respectively. Among the PEG fractions of AP, the highest SIA (17.9 U/mg) and recovery (18.4 %) was found in the PEG1 fraction for BR, while the PEG2 fraction gave the highest SAI (220.8 U/mg) and recovery (11.8 %) for PED. However, all the PEG fractions of BH showed no effect on the inhibitory activity for BR and PED. Of the PEG fractions, the PEG1 fraction of ST and YT showed the highest SIA for BR (72.6 and 45.7 U/mg, respectively) and PED (618.6 and 566.2 U/mg, respectively). From this result, it can be stated that the cysteine inhibitor from the PEG fraction of AP, ST, and YT is more concentrated in the PEG1 fraction (0–5 %). The highest SIA for CH was observed in the PEG4 fractions of AP, ST, and YT except for BH. The SIA of 9278.3, 6687.0, and 3951.1 U/mg with recoveries of 12.0, 49.1, and 68.7 % were obtained for AP, ST, and YT, respectively. The SIA and recovery for TR were highest in the PEG4 fraction of the four fish species. The SIA and recovery for TR in the PEG4 fraction were 1170.9 U/mg and 45.2 % for AP, 98.2 U/mg and 19.8 % for BH, 2064.2 U/mg and 312.4 % for ST, and 1536.2 U/mg and 419.2 % for YT. From the result, the greater SIA and recovery of the PEG4 fraction suggested that a higher amount of serine protease inhibitor was precipitated in the PEG concentration range of 20–40 %.
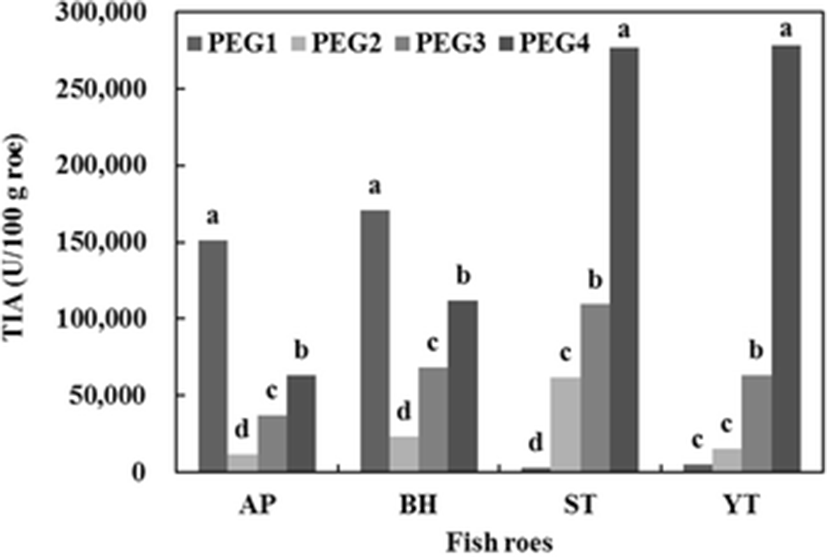
Total inhibitory activity (TIA, U/100 g roe) of PEG fractions for trypsin using BANA as a specific substrate is shown in Fig. 4. Among all precipitates obtained from AP and BH, the PEG1 fraction had the highest inhibitory activity, followed by PEG4, PEG3, and PEG2 fraction. TIAs of 151,206.6 and 170,464.7 U/100 g roe were recovered in the PEG1 fraction toward AP and BH, respectively. Whereas, it was observed that PEG precipitation for ST and YT gave maximum recovery of the inhibitor in a 20–40 % fraction (PEG4). Approximately 61.4 and 77.1 % of the total inhibitory activity of all PEG fractions were recovered in the PEG4 fraction of ST and YT, respectively. From the results, the serine protease inhibitor from four fish roes was more likely concentrated in the PEG1 (for AP and BH) and PEG4 fraction (for ST and YT).
Fractionation was commonly selected as a first step of purification, because the fractionation significantly reduced the volume of the solution and effectively removed contaminated proteins (Burnouf 1995). Rawdkuen et al. (2007) reported that PEG fractionation was more effective than AS fractionation. PEG might induce the conformational changes in the way which favored the inhibition of protease (Rawdkuen et al. 2005). Hao et al. (1980) reported that a variety of protease inhibitors were found in the 0–20 % PEG4000 fraction of plasma.
The native PAGE of the PEG fractions is shown in Fig. 5a. The PEG1, PEG2, and PEG3 fractions from AP contained protein bands similar to those of CE. A weakly cationic protein band which appeared in the PEG4 fraction of AP was rarely found in other fractions. In the CE of BH, protein bands with cationic proteins, weakly cationic protein, and weakly anionic protein were observed. After fractionation, increase in the weakly cationic protein bands was observed with increasing PEG concentration. The CE from ST and YT showed a similar protein pattern with cationic protein, weakly cationic protein, and weakly anionic protein bands. The PEG4 fraction from ST and YT consisted of bands with weakly cationic protein and weakly anionic protein as the major components.
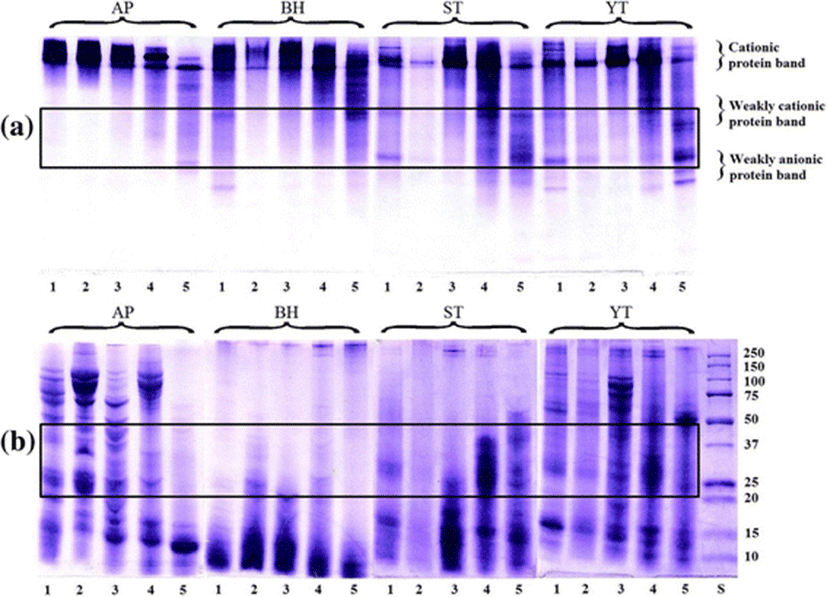
The molecular weight distributions of the PEG fractions estimated from the mobility in SDS-PAGE are shown in Fig. 5b. The CE of AP contained a variety of proteins with different high and low molecular weights. Protein bands in the ranges of 150–75, 50, 25–20, and 15–10 K were observed. The PEG1, PEG2, and PEG3 fractions also had a pattern similar to that of CE from AP. Whereas, the PEG4 fraction showed only a low molecular band in the range of 15–10 K. Similar protein patterns were observed among the CE and PEG fractions from BH, in which low molecular proteins were predominant. The CE from ST had protein bands in the ranges of 25–20 and 15–10 K. The PEG1 and PEG2 fractions showed low molecular protein bands (25–10 K). The PEG3 and PEG4 fractions showed bands with higher molecular weight protein than those of PEG1 and PEG2 fractions. The CE from YT contained protein bands with a different molecular weight. After fractionation, the molecular band in range of 15–10 K was retained in the PEG4 fraction.
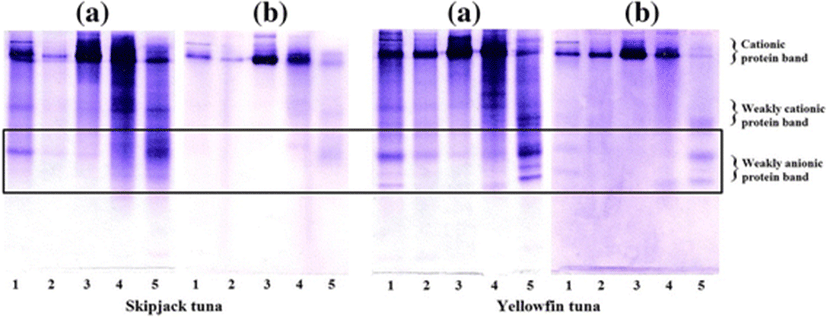
Due to the high serine protease inhibitory activity, the PEG fractions of ST and YT were selected. The native PAGE patterns and inhibitory activity staining for chymotrypsin of PEG fractions are depicted in Fig. 6. For native PAGE (Fig. 6a), a similar protein pattern was observed in CE (lane 1) and PEG4 fraction (lane 5), in which bands with weakly cationic protein and weakly anionic protein were dominant. The inhibitory activity staining of the PEG fractions from ST was similar to that of YT (Fig. 6b). All PEG fractions showed a dark major band with cationic protein bands observed. Whereas, inhibitory activity staining revealed that the weakly anionic proteins are the predominant proteins in PEG4. From the result, using 20–40 % PG fractionation was found to be an effective method to fractionate the serine protease inhibitor from ST and YT roes.
Conclusions
The protease inhibitor from fish roes was successfully fractionated by using 200–400 g PEG/L. The PEG fractions from fish roes obtained showed high inhibitory activity against trypsin and chymotrypsin as serine protease. PEG is commonly exploited in large-scale protease inhibitor preparation or purification from fish roes for both seafood and surimi industry use.


