Introduction
Tuna, belonging to the Scombridae family (Song et al., 2020), is an important marine food resource for its high nutritional and economic value (Zhang et al., 2019). It is widely distributed in tropical and subtropical region of Indian, Pacific and Atlantic Ocean (Kunal et al., 2013), and accounting for about 10% of the international seafood market (Brill & Hobday, 2017). Skipjack tuna (Katsuwonus pelamis) is the most abundant tuna species (Soares et al., 2019), accounting for 59.1% of the total tuna production (Herpandi et al., 2017). Though tuna is traditionally considered as a high-protein and low-fat food, lipids are an indispensable component in tuna, for example as the main metabolic energy source for swimming, growth and reproduction (Tocher, 2003).
The muscle tissue of tuna was rich in protein (20%–25%) and low in fat (< 2%) (Karunarathna & Attygalle, 2012). Many studies on tuna focus on the protein components of tuna (Jiang et al., 2019; Yu et al., 2021), few were undertake about the lipid components despite its great important physiological actions. Lipids have been recognized as a macronutrient with many exclusive biological functions (He et al., 2021), such as signal transduction, energy storage as well as cellular structural support (Hou et al., 2008). As one of the main daily dietary sources of essential fatty acids (FAs), fish lipids have attracted more and more attention for their heathy benefits to humans (Li et al., 2020). The unsaturated fatty acids (UFAs) in fish are superior to the saturated fatty acids in cheese and butter (Wang et al., 2019). And tuna is widely known to rich in phospholipids (PLs), sphingolipids (SLs), glycerolipids (GLs) and fatty acids. FA is a kind of lipid with the simplest structure but it is a basic component of many lipids. Tuna lipids can provide considerable amounts of polyunsaturated fatty acids (PUFAs), such as eicosapentaenoic acid (EPA) and docosahexaenoic acid (DHA) (Howe et al., 2006). EPA and DHA play an important role in preventing hyperlipidemic diseases and helping infant development (Bettadahalli et al., 2020; Dyall, 2015) and reducing the risk of atherosclerosis (Steffens, 2016) and coronary heart diseases (Siscovick et al., 2017). And increasing ω-3/ω-6 ratio in daily meal can reduce the plasma lipid concentration and the obesity risk (Simopoulos, 2016) as well as cancer (Layé et al., 2018; Manson et al., 2019). As a result, it is widely recommended to consume 250–1,000 mg of EPA/DHA per day to promote health (Kuratko & Salem, 2013). PLs as the primary structural constituents of biological membranes (Shen et al., 2016), play an important role in maintaining the stability of cell membranes (Mukhamedova & Glushenkova, 2000). In addition, PLs have positive nutritional properties, for instance the intake of phospholipids can improve memory and cognitive function of human beings (Crichton et al., 2012). SLs are consisted of a long-chain fatty acid, a sphingosine or its derivatives, and a polar head group (Wang et al., 2019). The polar head group of SLs is combined with the hydroxyl group of sphingosine while the fatty acid forms an amide bond with its amino group. Therefore, SLs have a polar head group and two non-polar tails including long-chains fatty acids and sphingosine. And SLs are the second largest group of membrane lipids after PLs. Changes in SLs will affect the physical properties of cell membranes, thus affecting the function of membrane proteins. Ceramide (Cer), sphingomyelin (SM) and hexosylceramide (HexCer) are the most common SLs (Han et al., 2012). GLs is one of the most important energy sources in organisms. The structure of glycerides is relatively simple, composed by fatty acid and esterification of glycerol hydroxyl. Triglycerides (TGs) are the most common esters of glycerides, and they can be broken down into monoglycerides (MGs) or diglycerides (DGs). The function of lipids was highly related to its structure. Thus, the lipid analysis is of great importance.
Many traditional methods have been used for lipid profile analysis, such as thin-layer chromatography (TLC), gas chromatography (GC) or combination of gas chromatography/mass spectrometry (GC/MS) (Wenk, 2005). However, these methods are usually very time-consuming and can only provide limited information of lipids. Shotgun lipidomics is easy to operate and less time-consuming (Li et al., 2011), and has been widely used for characterization of the major lipid classes (Liang et al., 2017). However, direct infusion analysis causes signal loss of low-abundance lipid groups due to ionization suppression (Jessome & Volmer, 2006; Wang et al., 2016). Fortunately, this problem can be easily solved by liquid chromatographic separation. The lipid profiles can be comprehensive determined in an injection through ultrahigh-performance liquid chromatography coupled to high resolution mass spectrometry (UPLC-HRMS) (Sun et al., 2020) with fast speed and high sensitivity, and it is more suitable for untargeted lipidomic analysis (Indelicato et al., 2017).
In the present study, the lipid profiles, including PLs, SLs, GLs and FA of Skipjack tuna were analyzed using UPLC-HRMS. The aim of this study was to provide a useful tool for high-throughput lipidomic analysis and nutritional value assessment of tuna as a valuable high-quality food for human beings.
Materials and Methods
The Skipjack tuna was supplied by Zhejiang Retronx Foodstuff and transported on ice to our laboratory within 4 h and stored at –20°C before use. Chloroform was supplied by Sinopharm Chemical Reagent (Shanghai, China). Isopropanol and methanol and were obtained from Merck (Darmstadt, Germany). Ammonium formate and formic acid were purchased from Sigma-Aldrich (St. Louis, MO, USA) and Fluka (Buchs, Switzerland) respectively. Ultrapure water was generated using a Milli-Q system (Bedford, MA, USA). All the chemicals used for LC-MS analysis were of LC-MS grade.
Fifteen Skipjack tuna individuals were randomly divided into 3 groups with each group containing 5 individuals. The white meat of each group Skipjack tuna was ground into powder by an analytical mill (IKA, Königswinter, Germany) in liquid nitrogen bath. The powder was stored at –20°C before use.
The extraction of total lipids refers to the Folch method (Folch, 1957) as follows: 0.2 g powder sample of Skipjack tuna was placed in a10-mL centrifuge tube. A 6 mL of chloroform/methanol (2:1, v/v) was added to extract the total lipids using a homogenization for 10 s at 10,000 r/min. After that, 2 mL of ultra-pure water was added into the mixture, vortexed for 20 s before centrifugation at 5,000 r/min for 10 min. The organic phase was collected while the water phase was re-extracted twice according to the same procedure. The lipids in organic phase were combined and dried under a flow of nitrogen. The lipids were re-dissolved in 1 mL isopropanol/acetonitrile (2:1, v/v). During the extraction processes, the temperature was conducted at 4°C to minimize lipid oxidation.
Lipids separation was conducted on a Thermo Scientific Dionex UltiMate 3000 UPLC system with a Waters ACQUITY UPLC CSH C18 Column (100 × 2.1 mm, 130 Å, 1.7 µm, Milford, MA, USA) according to the optimized lipid separation method (Li et al., 2020). The mobile phases were composed of mobile phase A of isopropanol: acetonitrile (85:15, v/v), and mobile phase B of acetonitrile: water (65:35, v/v), and both mobile phases contain 0.1% of formic acid and 5 mmol/L of ammonium formate. A linear gradient (15% A, 0 min; 15%–25% A, 0−2 min; 25%–40% A, 2−3 min; 40%–75% A, 3−15 min; 75%–99% A, 15−20 min; 99% A, 20−25 min; 99%–15% A, 25–26 min; and 15% A, 26–30 min) was used. The flow rate of the mobile phase was 0.35 mL/min. The column temperature was 50°C. The injection volume was 5 μL.
The effluent was introduced into a Thermo Scientific Q-Exactive Orbitrap mass spectrometer in both the ESI+ and ESI− modes. The resolution of mass spectrum was set to 70,000. The source conditions were set as follows: spray voltage of +3.5 kV in ESI+ and -3.5 kV in ESI−, heater temperature at 320°C, and the collision energies were 45 and 60. The extracts were performed in automatic MS/MS mode as Full MS range of m/z 100–1,500 and fragment ion range of m/z 200–1,200.
Raw data acquired from the UPLC-HRMS were analyzed by open-source software MS-DIAL (version 4.24) (Tsugawa et al., 2020). LipidMsmsBinaryDB-VS68-FiehnO which adjusted by LC-MS method of Oliver Fiehn laboratory was used as library for lipid identification. [M+H]+, [M+NH4]+, [M+Na]+ and [M+K]+ were selected in positive ionization mode while [M–H]– and [M+HCOO]– were selected in negative ionization mode for adduct ions. Mass accuracy (0.01 Da for MS1 and 0.05 Da for MS2) and MS/MS spectra similarity (higher than 70%) were used to identify the lipid molecular species in Skipjack tuna. And the peak areas of lipid molecular species were used for quantitation. And the quantitation data of lipid molecular species were exported for further statistical analysis.
Results and Discussion
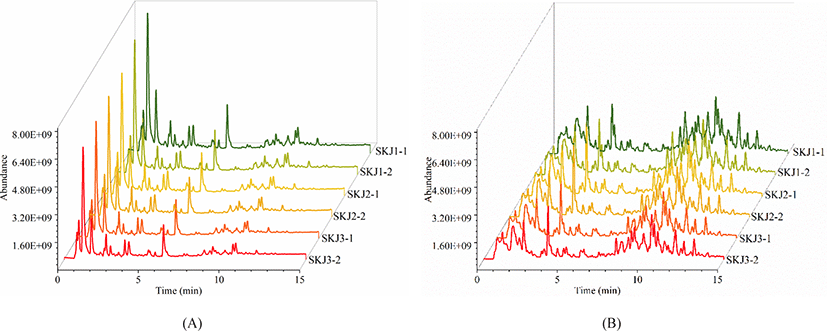
To enhance the acquisition of comprehensive lipid information, the cross-acquisition in both positive ion mode and negative ion mode were performed. Fig. 1 illustrates the total ion chromatogram (TIC) scan spectra of lipids in Skipjack tuna. The response of the mass spectrometer was relatively high, and the eluting components are mainly concentrated in 4–12 min in the positive ion mode while the response of the mass spectrometer is relatively low, and the eluting components are mainly concentrated in 4–14 min in the negative ion mode. TICs of lipid extracts showed similar patterns in positive ion mode and negative ion mode respectively, illustrating the stability of the system during the data acquisition. However, TICs of lipid extracts showed different spectra in positive ion mode and negative ion mode, implying that the responses of lipids in the positive and negative ion mode were different. Besides, TICs of lipid extracts in Skipjack tuna showed high responses and dense peaks, indicating that the acquisition method was promising.
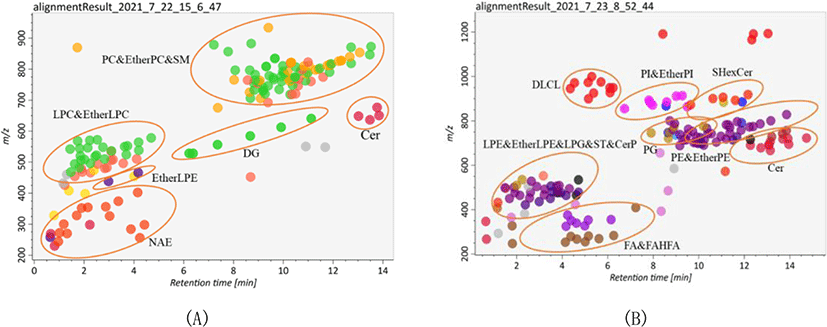
Lipid identification and quantitation of Skipjack tuna were carried out by MS-DIAL software. As a result, 156 and 145 lipid molecular species were identified with both MS1 and MS2 information in positive ion mode and negative ion mode respectively (Fig. 2). It was clear that the elution time of the main lipid molecule species in the two ion modes was consistent with the TIC scan spectra (Fig. 1). In the positive ion mode, phosphatidylcholine (PC), lysophosphatidylcholine (LPC), lysophosphatidyl ethanolamine (LPE), N-acylethanolamine (NAE), SM and ceramide (Cer) were detected as their [M+H]+ ions, diacylglycerol (DG) was detected as [M+NH4]+ ions (Fig. 2A). In the negative ion mode, FA, branched fatty acid esters of hydroxy fatty acids (FAHFA), N-acyl-lysophosphatidylethanolamine (LNAPE), CerP, dilysocardiolipin (DLCL), phosphatidic acid (PA), lysophosphatidic acid (LPA), LPE, lysophosphatidylglycerol (LPG), lysocardiolipin (MLCL), phosphatidyl inositol (PI), phosphatidylethanolamine (PE), phosphatidylglycerol (PG) and sulfatides hexosyl ceramide (SHexCer) were detected as their [M–H]– ions, LPC and Cer were detected as their [M+HCOO]– ions, sulfatide (ST) was detected as [M–H]– and [M+HCOO]– ions, DG and triacylglycerol (TG) were detected as their [M+H]+ and [M+NH4]+ ions (Fig. 2B). Besides, some lipid molecular species were also identified only with MS1 information but have high intensities. These lipid molecular species can also be used to assist the lipid profile analysis.
In this study, a comprehensive analysis of PLs, SLs, GLs and FA was performed to clarify the nutritional value of Skipjack tuna meat. The number of lipid molecular species and relative percentage of each lipid class in Skipjack tuna were shown in Table 1. As shown in Table 1, PLs were dominant in Skipjack tuna, accounting for 74.10% of the total lipids. The percentages of SLs and GLs were considerable, accounting for 12.30% and 13.60% of the total lipids respectively. These results were different from previous reports (Balogun & Talabi, 1984; Hiratsuka et al., 2004) because of the different sources and parts of raw materials, extraction methods, detection equipment and identification software.
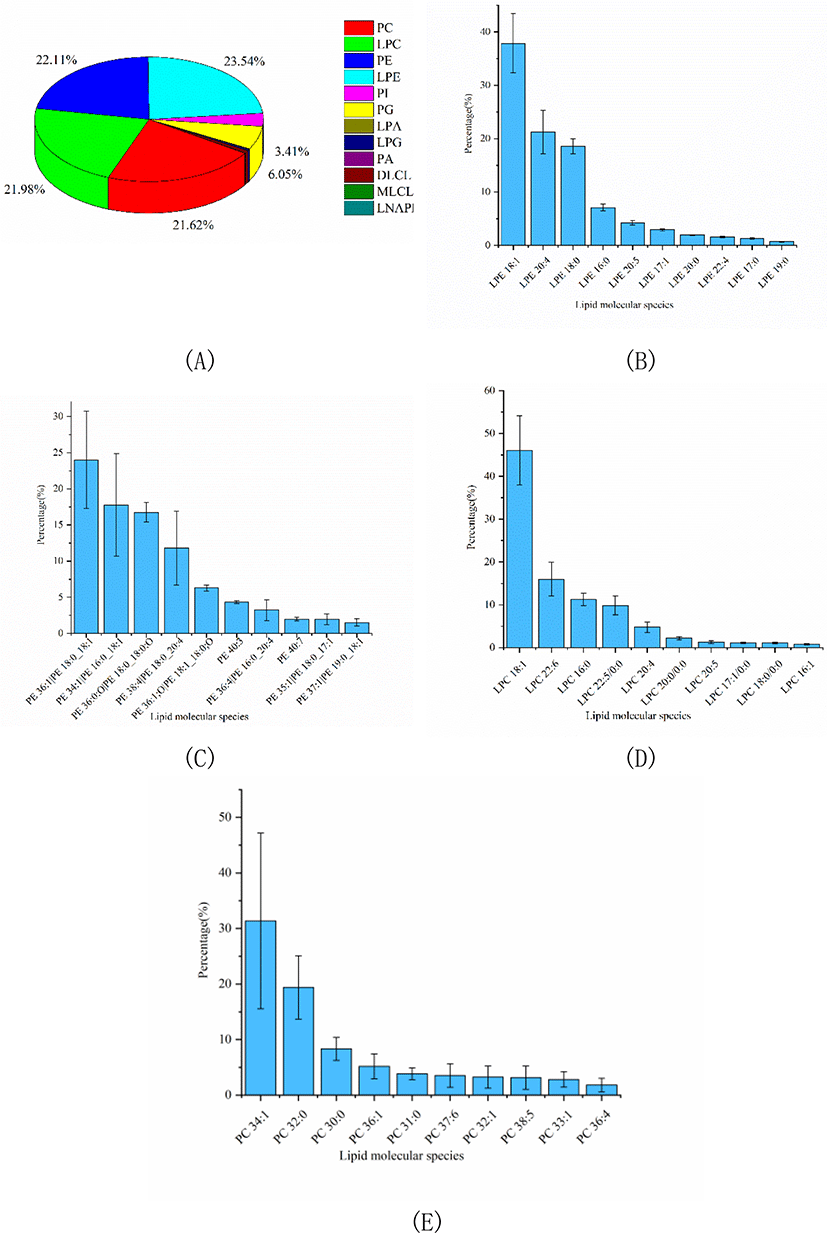
PLs in tuna were complex and could be divided into several into several subclasses based on the different polar head groups, such as PC, PE, PA, PI, PG, LPC, and LPE et al. In this study, untargeted lipidomics was carried out to characterize the PLs profile of Skipjack tuna. Results showed that LPE, PE, LPC, and PC were the major PL subclasses in Skipjack tuna, accounting for 23.54%, 22.11%, 21.98%, and 21.62% of the total PLs respectively, followed by PG and PI, accounting for 6.05% and 3.41% of the total PLs respectively (Fig. 3A). The lipid molecular species with high abundance in each subclass of LPE, PE, LPC, and PC were shown in Fig. 3B–3E respectively. LPE (18:1) was the lipid molecule species with the highest content, accounting for 37.86% of the total LPE, followed by LPE (20:4) and LPE (18:0), accounting for 21.29% and 18.57% of the total LPE respectively. PE (18:0_18:1) was the lipid molecule species with the highest content, accounting for 24.01% of the total PE, followed by PE (16:0_18:1) and PE (18:0_18:0;O), accounting for 17.78% and 16.76% of the total PE respectively. LPC (18:1) was the lipid molecule species with the highest content, accounting for 46.07% of the total LPC, followed by LPC (22:6) and LPC (16:0), accounting for 15.97% and 11.23% of the total LPC respectively. PC (34:1) was the lipid molecule species with the highest content, accounting for 31.38% of the total PC, followed by PC (32:0) and PC (30:0), accounting for 19.39% and 8.32% of the total PC respectively.
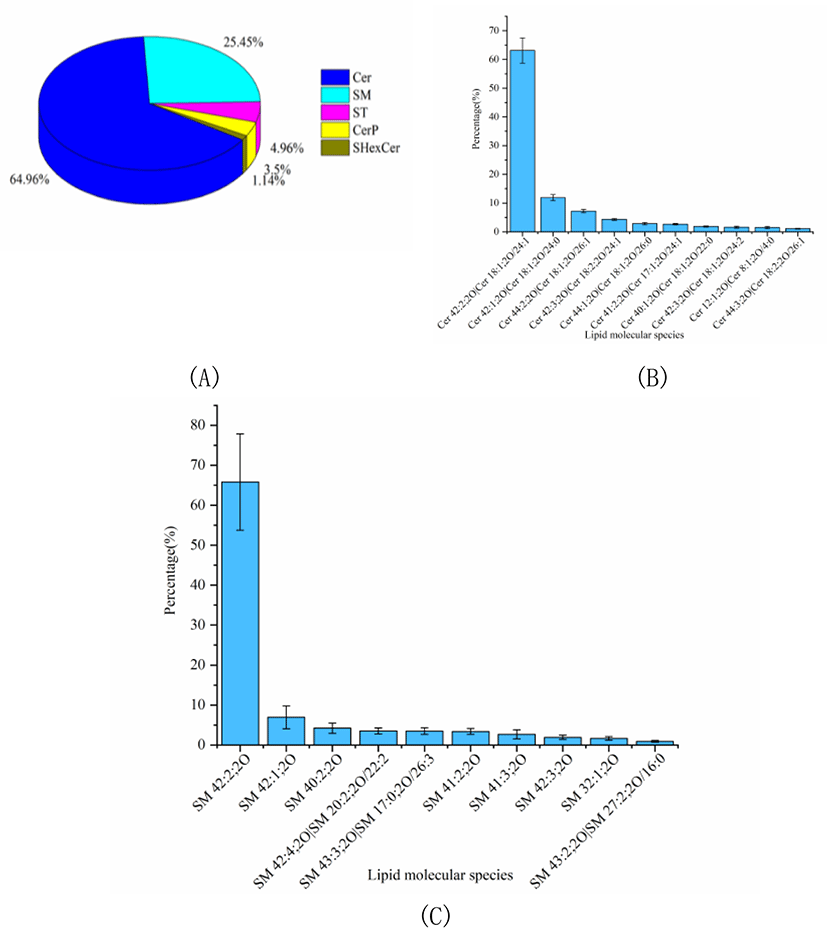
The percentage of SL was considerable in Skipjack tuna meat, accounting for 12.30% of the total lipids. The SL profile of Skipjack tuna was characterized for its essential function in regulating signal transduction processes such as cell growth, differentiation, aging and death. As shown in Fig. 4A, Cer was the predominant SL subclass in Skipjack tuna, accounting for 64.96% of the total SLs, followed by SM and ST, accounting for 25.45% and 4.96% of the total SLs respectively (Fig. 4A). The lipid molecular species with high abundance in each subclass of Cer and SM were shown in Fig. 4B–4C respectively. Cer (18:2;2O/24:1) was the lipid molecule species with the highest content, accounting for 63.09% of the total Cer, followed by Cer (18:1;2O/24:0) and Cer (18:1;2O/26:1), accounting for 11.91% and 7.21% of the total Cer respectively. SM (42:2;2O) was the lipid molecule species with the highest content, accounting for 65.82% of the total SM, followed by SM (42:1;2O) and SM (40:2;2O), accounting for 6.93% and 4.21% of the total SM respectively.
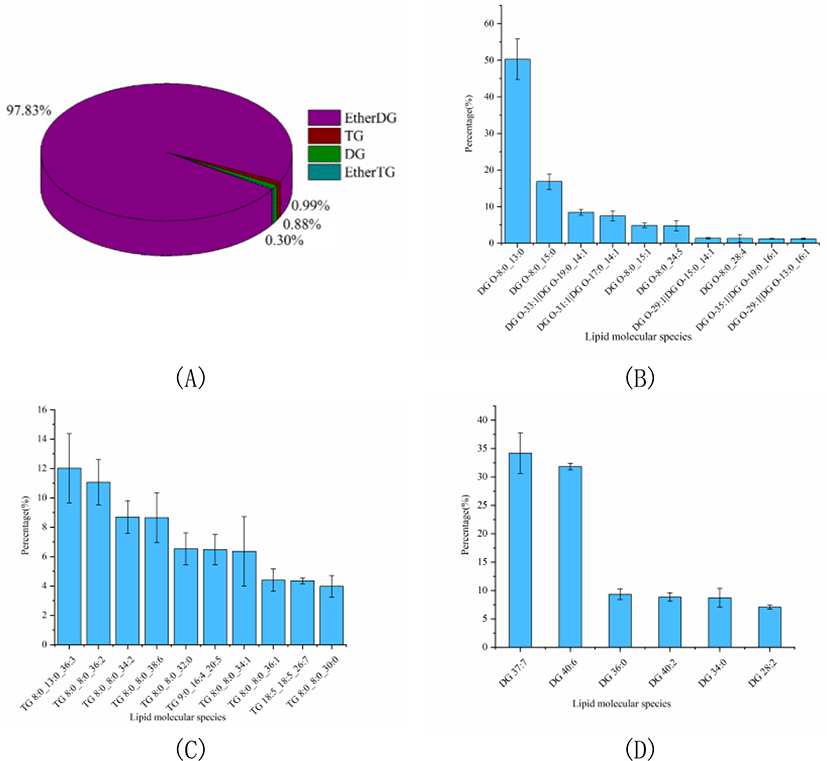
The percentage of GLs was slightly higher than that of SL, accounting for 13.60% of the total lipids. And the GLs profile of Skipjack tuna was also analyzed. As shown in Fig. 5A, ether DG was the dominant GL class of Skipjack tuna, accounting for 97.83% of the total GLs. The rest of the GL class were TG, DG and ether TG, accounting for 0.99%, 0.88%, and 0.30% of the total GLs respectively. The lipid molecular species with high abundance in each subclass of ether DG, TG and DG were shown in Fig. 5B–4D respectively. DG (O-8:0_13:0) was the lipid molecule species with the highest content, accounting for 50.27% of the total ether DG, followed by DG (O-8:0_15:0) and DG (O-19:0_14:1), accounting for 16.84% and 8.44% of the total ether DG respectively. TG (8:0_13:0_36:3) was the lipid molecule species with the highest content, accounting for 12.02% of the total TG, followed by TG (8:0_8:0_36:2) and TG (8:0_8:0_34:2), accounting for 11.07% and 8.69% of the total TG respectively. DG (37:7) and DG (40:6) were dominant lipid molecule species, accounting for 34.21% and 31.82% of the total DG respectively, followed by DG (36:0) and DG (40:2), accounting for 9.33% and 8.85% of the total DG respectively.
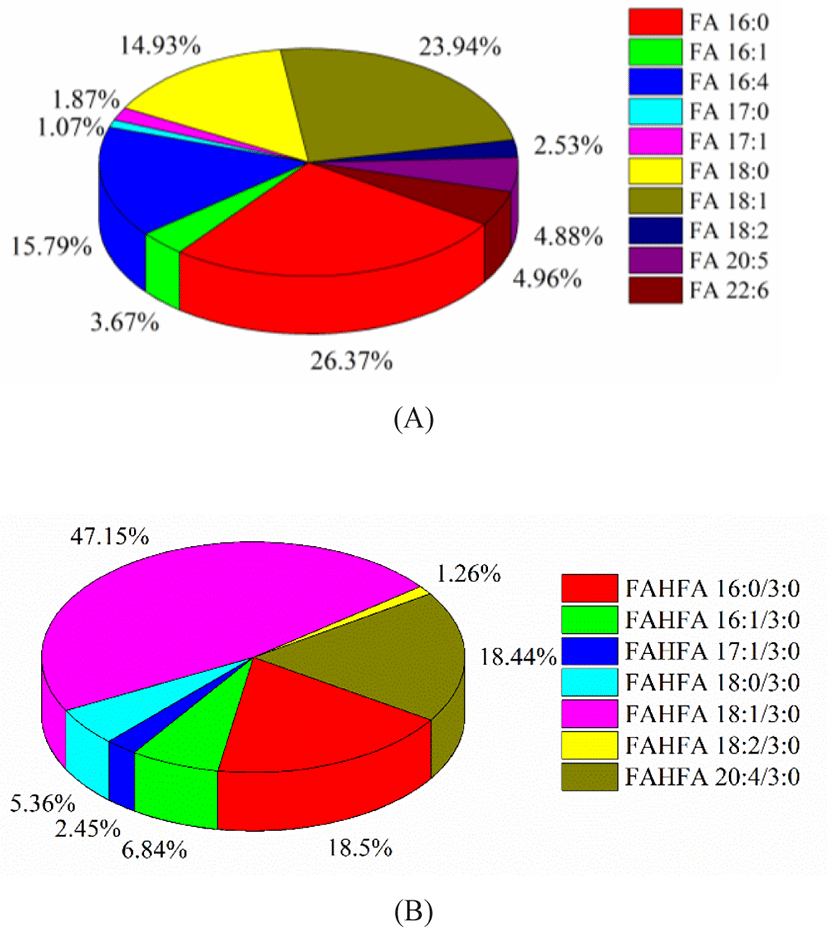
FA profile of Skipjack tuna was obtained in negative ion mode. The fatty acids in tuna meat were mostly UFAs. As shown in Fig. 6A, palmitic acid (FA 16:0) and oleic acid (FA 18:1) were the dominant components, accounting for 36.27% and 23.94% of the total fatty acids. The percentages of C16H24O2 (FA 16:4) and stearic acid (FA 18:0) were considerable, accounting for 15.79% and 14.93% of the total fatty acids. The percentages of DHA (FA 22:6) and EPA (FA 20:5) were 4.96% and 4.88% of the total fatty acids respectively. DHA and EPA belong to omega-3 UFAs and exhibite higher utilization efficiency compared with other lipid forms (Zhang et al., 2019). Besides, FAHFAs were detected as their [M–H]– ions in negative ion mode. FAHFA profile of Skipjack tuna was shown in Fig. 6B. FAHFAs as a new class of functional lipids reported in Skipjack tuna for the first time and play important roles in improving glucose tolerance, enhancing insulin sensitivity, maintaining blood sugar homeostasis, and anti-inflammatory, and attracting more and more attention of scientists (Aryal et al., 2021; Hu et al., 2021).
Conclusion
In this study, the lipid profile, including lipid classes and FA compositions of Skipjack tuna was determined by UPLC-HRMS through the cross-acquisition in both positive and negative ion modes and annotated by MS-DIAL software. PLs were dominant components in Skipjack tuna, followed by GLs and SLs. The fatty acids in tuna meat were mostly UFAs. Due to the high level of PLs and UFA compositions, such as DHA and EPA, tuna meat has huge potential for human health. These data can be useful for the nutritional value assessment of tuna meat as a valuable high-quality marine food for humans.


